

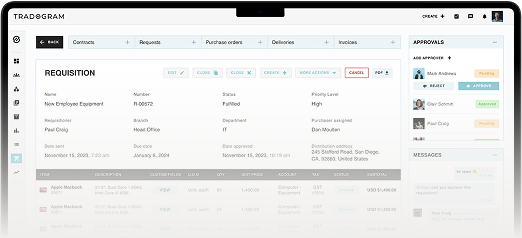
Your team pulls together the monthly procurement report. Cost savings look fine. Supplier on-time delivery looks fine. Then someone on the finance side asks why maverick spend crept up again this quarter, and nobody can point to the metric that would have caught it three weeks earlier.
That's the gap between having procurement KPIs and having the right ones. Most procurement teams track something. Fewer teams track the handful of numbers that actually drive decisions, such as whether to renegotiate a contract, whether a supplier needs a formal review, or whether a department is about to run through its budget before the invoice even arrives.
This guide covers the procurement key performance indicators (KPIs) worth tracking, what a reasonable benchmark looks like for each one, and how to keep the reporting accurate without rebuilding a spreadsheet every month.
What are procurement KPIs?
Procurement KPIs (key performance indicators) are the measurements a procurement team uses to track how well its purchasing process is performing against a specific goal, whether that goal is cost, speed, compliance, or supplier reliability. A procurement KPI is different from a raw number. Total spend for the quarter is a number. Spend under management, the share of that total spend that goes through an approved, controlled process, is a KPI, because it tells you something about how much control your organization actually has over its purchasing.
Organizations use them to connect procurement activities, from strategic sourcing through payment, to broader business goals, and to confirm procurement processes are actually followed, not just assumed.
Procurement KPIs generally fall into a few buckets: cost (what you paid and what you saved), performance (how well suppliers and the process itself perform), compliance (whether purchasing followed policy), and efficiency (sometimes called procurement efficiency or operational KPIs), which covers how long each step takes. A useful set of procurement metrics typically draws from all four buckets, not just cost, and should tie back to your organization's broader procurement strategy rather than be a one-off report.
Why procurement KPIs matter
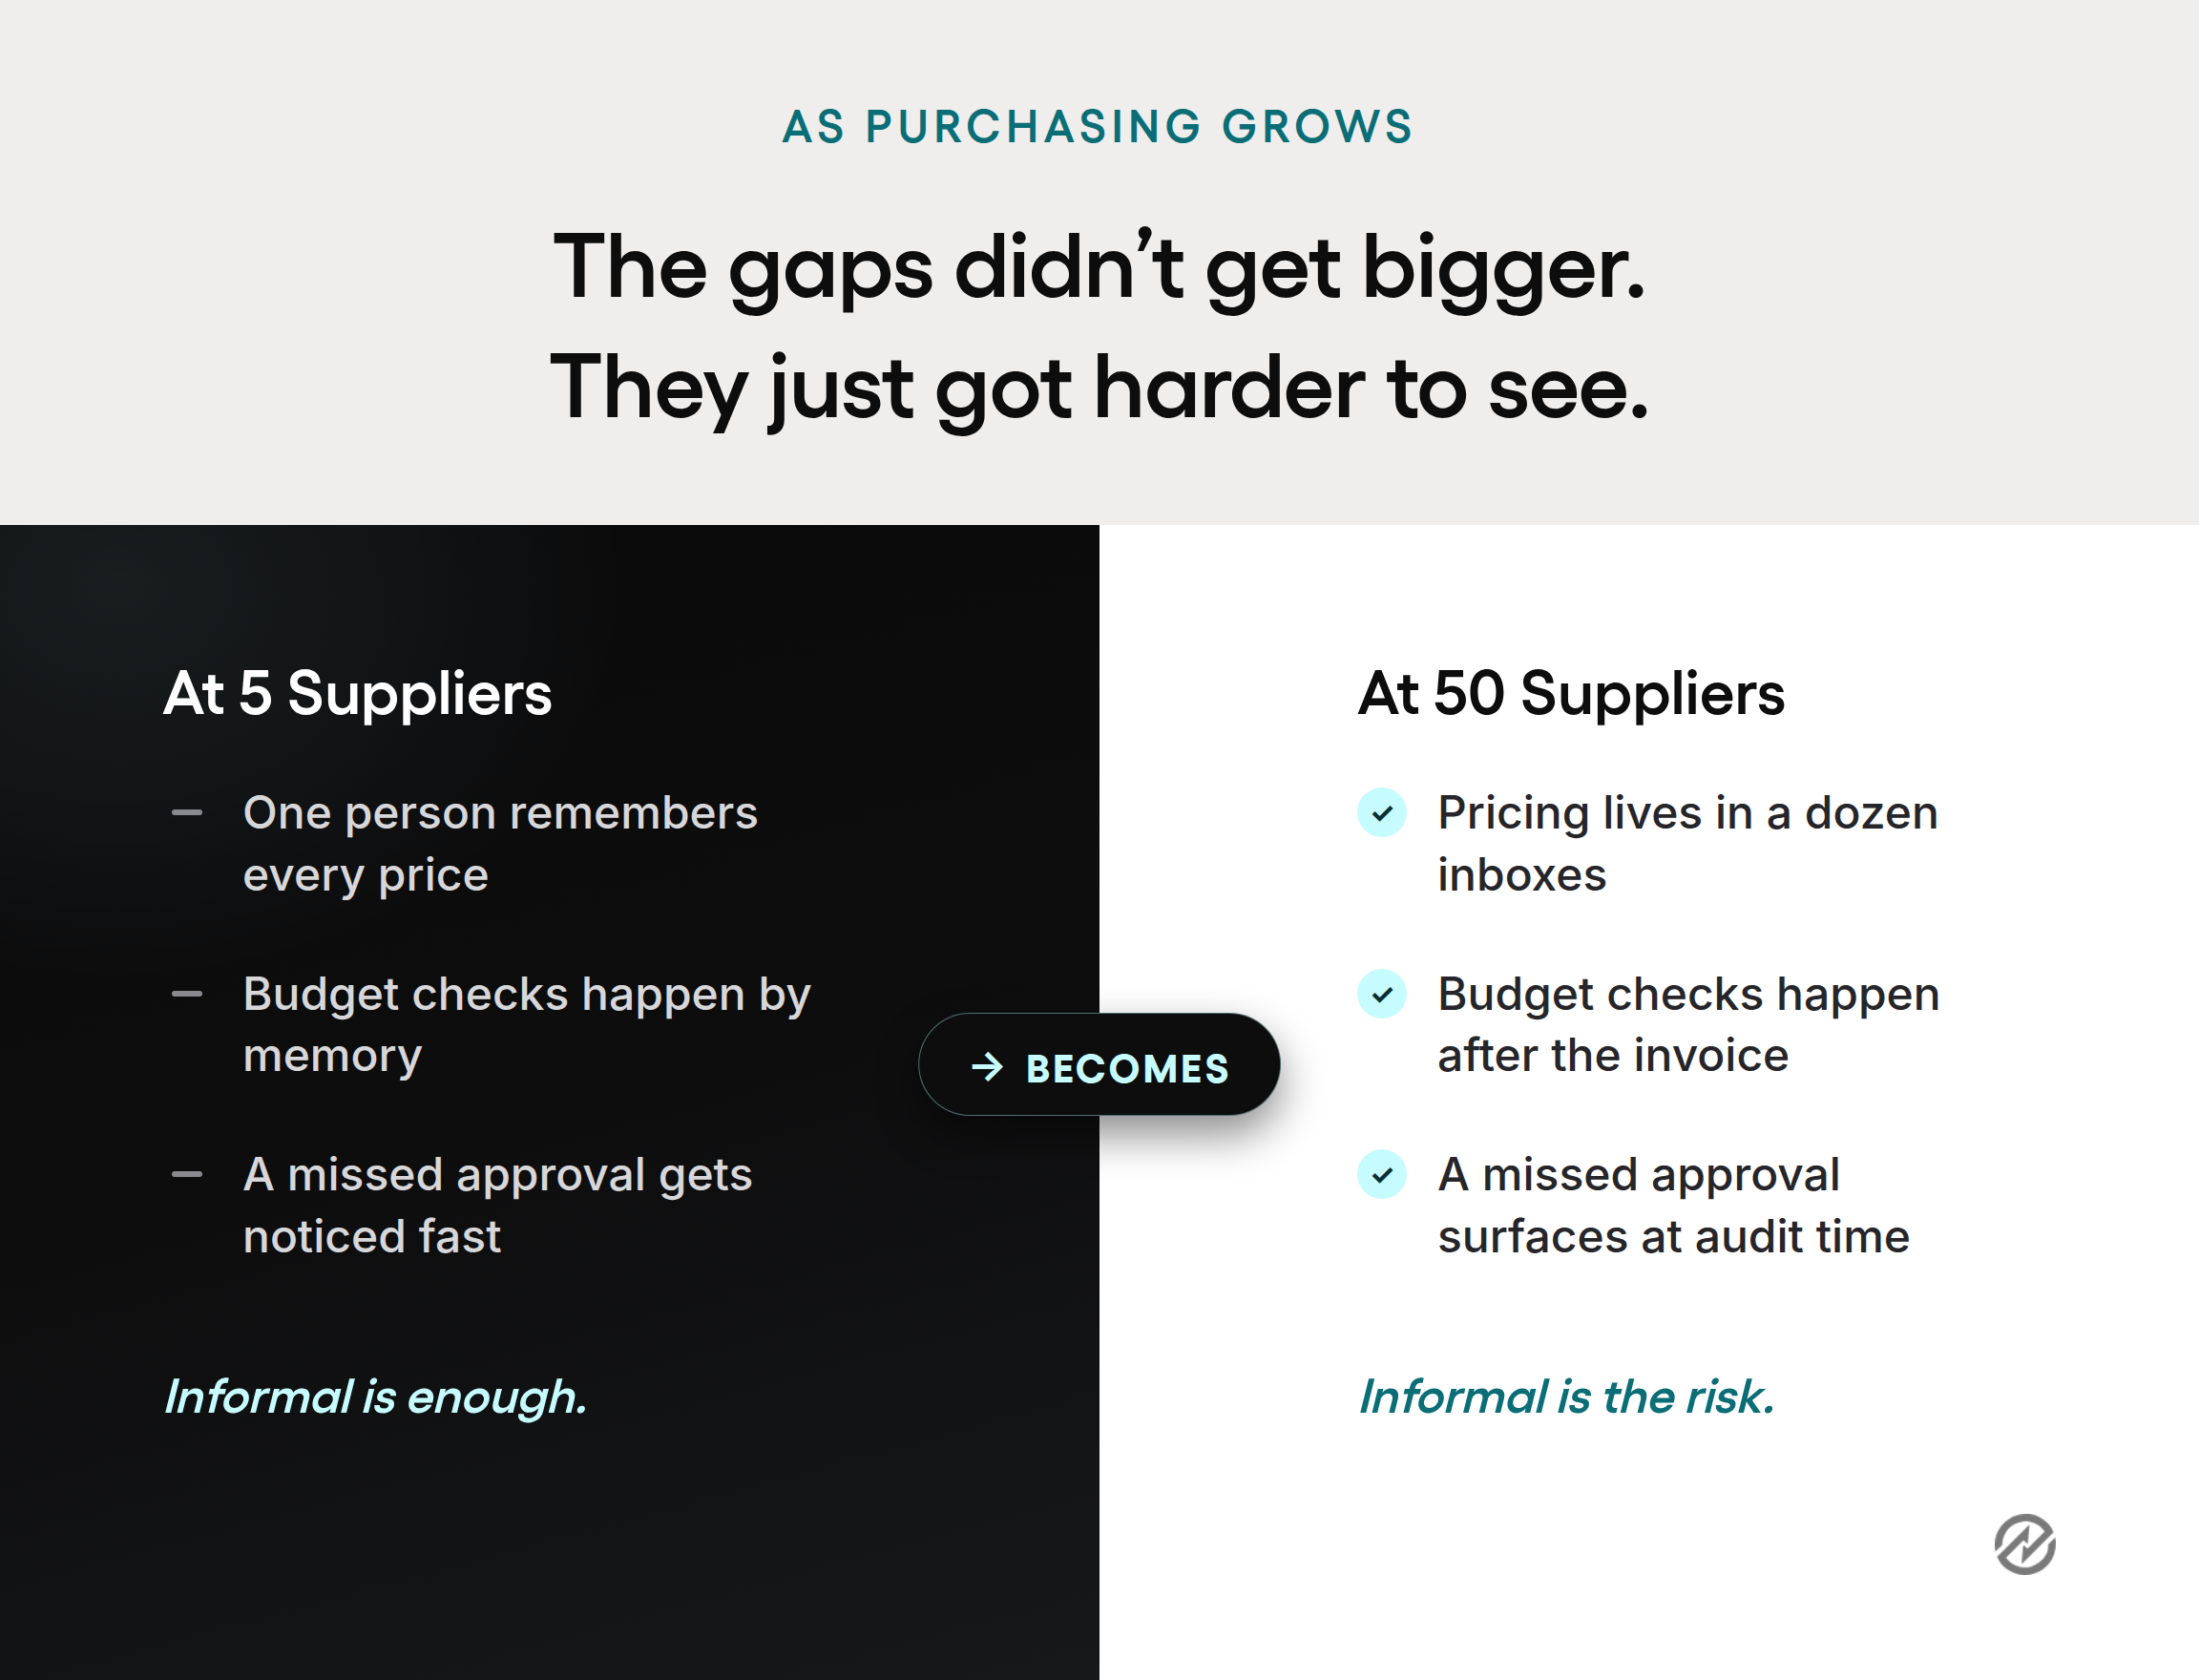
KPIs matter more as an organization grows, not less. A purchasing process built for 40 employees and a handful of suppliers can run informally, on memory and a few spreadsheets, and nobody notices the gaps. Add more departments, more approvers, and more suppliers, and that same informal process starts hiding problems instead of preventing them: a duplicate payment here, an off-contract purchase there, a budget that looked fine until the invoices caught up with it.
Procurement KPIs provide procurement leaders and professionals with an early warning system for exactly that kind of drift. They tell finance what's been committed before the invoice arrives, protecting the organization's financial health, tell procurement teams which suppliers are becoming a risk, and tell department leaders whether their team is buying inside or outside of policy.
None of that requires a large procurement function. It requires deciding in advance which key metrics actually matter for cost control, then reviewing them on a schedule rather than after something has already gone wrong.
The most important procurement KPIs to track
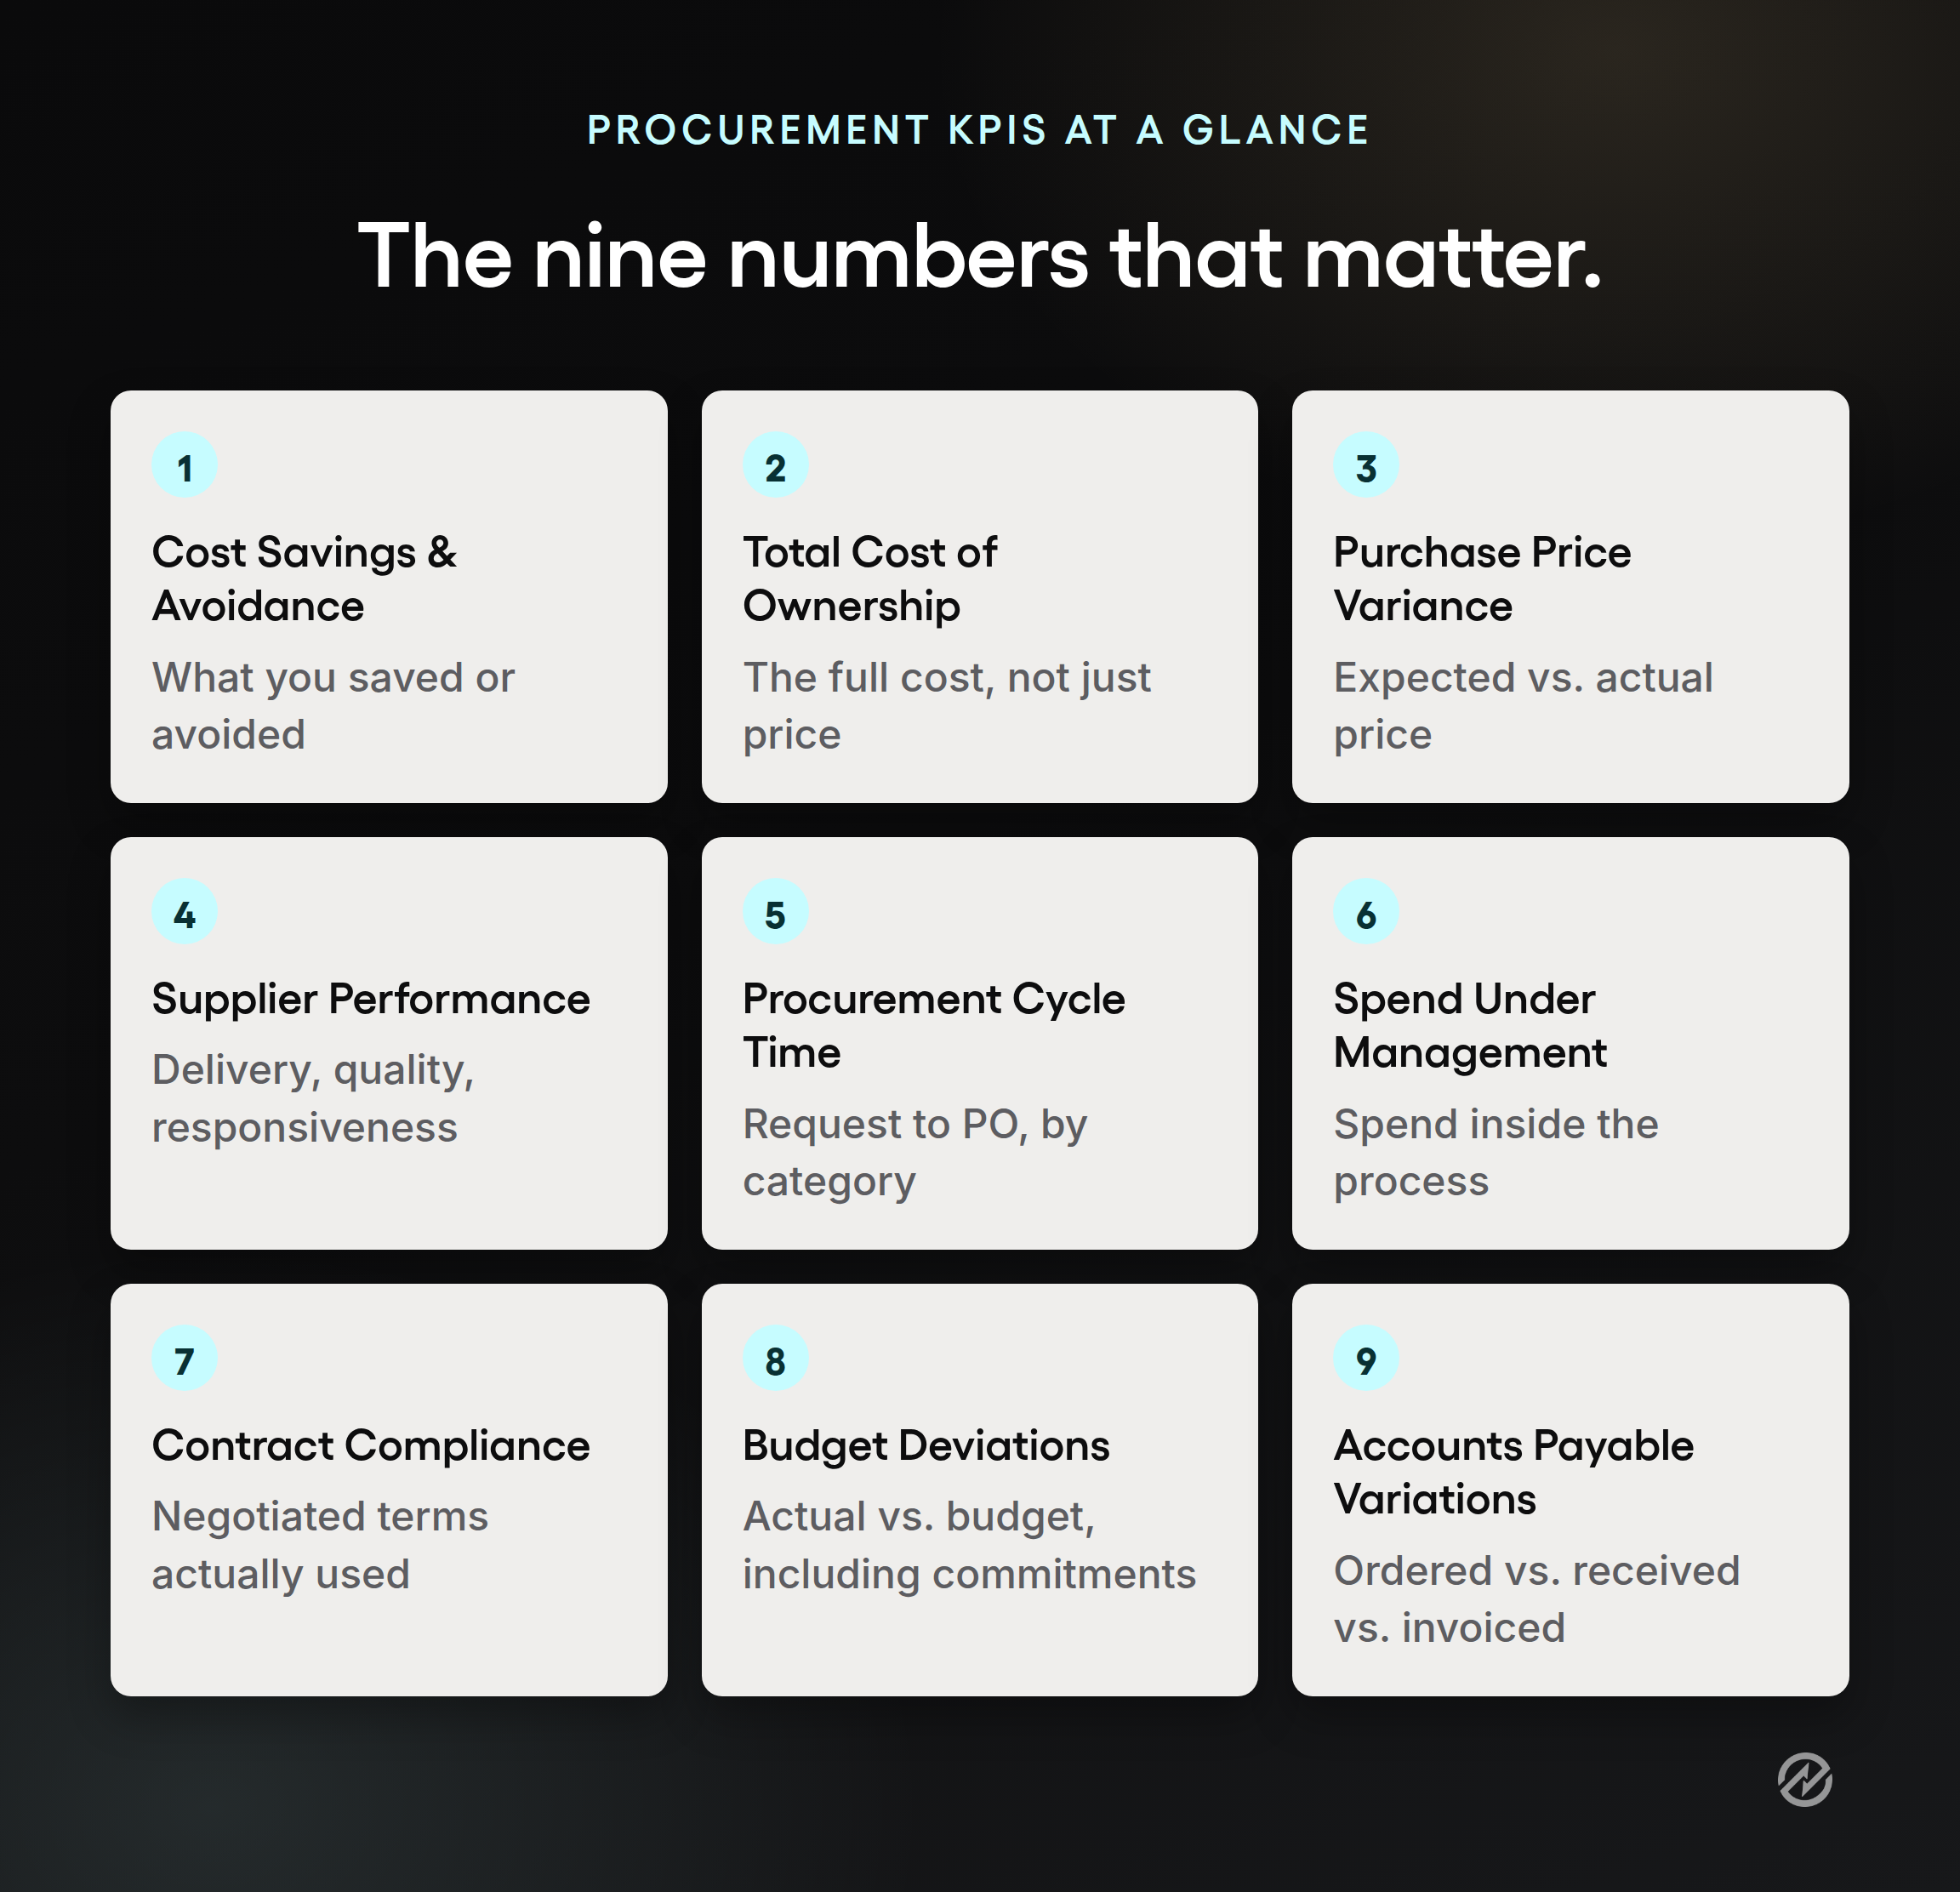
Not every number worth watching deserves its own line on a dashboard. The nine KPIs below cover what most procurement teams consider most important to start with, as each addresses a different operational question. Track fewer than this and a real problem can slip through. Track many more, and the dashboard turns into noise nobody reads.
1. Cost savings and cost avoidance
Cost savings are reductions that show up in next year's budget: a renegotiated rate, a switched supplier, or a consolidated order that reached a better pricing tier. Cost avoidance is different. It's the cost that never happened, like an 8% price increase a supplier proposed that got negotiated down to 3%. Nothing got cheaper on paper, but the organization avoided paying more.
Cost savings and cost reduction are usually the first metrics a CFO asks about, but these cost-saving KPIs only tell half the story without cost avoidance. Procurement ROI weighs what procurement spent against what it returned in savings and avoidance.
Both are worth tracking, and they shouldn't be reported as the same line. A team that only reports realized savings can look flat in a quarter where its real contribution was holding costs steady against a rising market. Technical America, a Tradogram manufacturing customer, reported roughly a 25% reduction in purchasing costs after consolidating its requisitions, purchase orders, receiving, and invoices into a single system instead of tracking each step separately, which is the kind of result that shows up once cost tracking has a single, consistent place to live. Reviewing procurement spending by category on a regular schedule is usually the fastest way to spot savings opportunities and lower operating costs before a contract renews on autopilot.
For example: Savings realization rate measures the percentage of projected cost savings that actually show up in the budget once a new contract or process takes effect, rather than staying a number from the original negotiation.
2. Total cost of ownership (TCO)
Purchase price is one input into total cost of ownership, not the whole answer. TCO adds in what a purchase costs after the invoice: maintenance, logistics, training, support, and eventual disposal or replacement, all of which add to operational costs long after the purchase order closes. A supplier with a slightly higher unit price can still be the cheaper option once those costs are counted.
TCO matters most for larger or recurring purchases, such as equipment, software, or a supplier relationship that will run for years. Involve the people who will actually maintain or use the purchase in the comparison, not just the people negotiating price. They usually know where the hidden costs lie, and comparing options by TCO rather than price alone is a reliable way to improve cost efficiency for a big purchase.
For example: Total cost of ownership adds the purchase price to the costs incurred over an asset's life, including maintenance, logistics, training, support, and disposal, to show the full cost of a purchase rather than just the number on the purchase order.
3. Purchase price variance
Purchase price variance (PPV) compares the price your organization expected to pay for an item against the price paid, multiplied by the quantity purchased. It's one of the oldest procurement KPIs, and it still catches things that many teams miss: a purchase made off-contract at a higher list price, a stale benchmark that nobody updated after a contract renewal, or a rush order that carried an expedite fee that nobody planned for.
The number only helps if you know what's actually driving it, and that depends on keeping the underlying procurement data up to date. For the full formula, worked examples, and a way to tell which part of a variance procurement can actually control, see Tradogram's guide to purchase price variance.
For example: Purchase price variance is calculated by multiplying the difference between the expected price and the actual price paid by the quantity purchased, which turns a single price gap into a dollar figure finance can act on.
4. Supplier performance
Supplier performance tracks factors that affect your organization, even though your team doesn't directly control them: on-time delivery rate, supplier defect rate, responsiveness, and the consistency with which a supplier maintains its pricing. A missed delivery date on one input can affect production or service levels before anyone traces it back to the supplier. Some teams also track supplier lead time and supplier availability, especially in categories exposed to supply chain disruptions, where a single vendor delay can threaten supply continuity and raise supplier risk across the category.
Keep the scorecard practical: a handful of metrics reviewed every quarter beats a long list nobody opens again. Centralizing supplier records, contracts, and performance notes in one place makes supplier relationship management feasible for a lean team, and effective vendor management helps mitigate risks and strengthen supplier relationships rather than reacting to them only. Supplier management tools built for this keep that information in one place by default.
For example: On-time, in-full (OTIF) combines two supplier metrics into one number, the percentage of deliveries that arrive both on time and with the correct quantity, while supplier defect rate and average lead time round out the picture by tracking quality and speed separately.
5. Procurement cycle time
Procurement cycle time, sometimes reported as purchase order cycle time, measures how long a purchase takes from the initial request to a completed purchase order, and sometimes all the way through to payment. Shorter cycle times usually mean requests aren't sitting in someone's inbox waiting on an approval, and purchase order accuracy is high enough that orders don't bounce back for correction. Improving this KPI tends to raise downstream operational efficiency as well, since a fast, accurate request is easier for everyone else to act on.
Cycle time is worth tracking by category, not just as a single company-wide average. A five-day average sounds fine until you notice that routine office supply orders take one day and anything requiring a new supplier takes three weeks, which is a much better clue to where the actual bottleneck lives.
For example: Purchase order cycle time measures the time from requisition to order fulfillment, a narrower slice of procurement cycle time that stops at fulfillment rather than running all the way through payment, which makes it easier to isolate a slow approval step from a slow supplier.
6. Spend under management
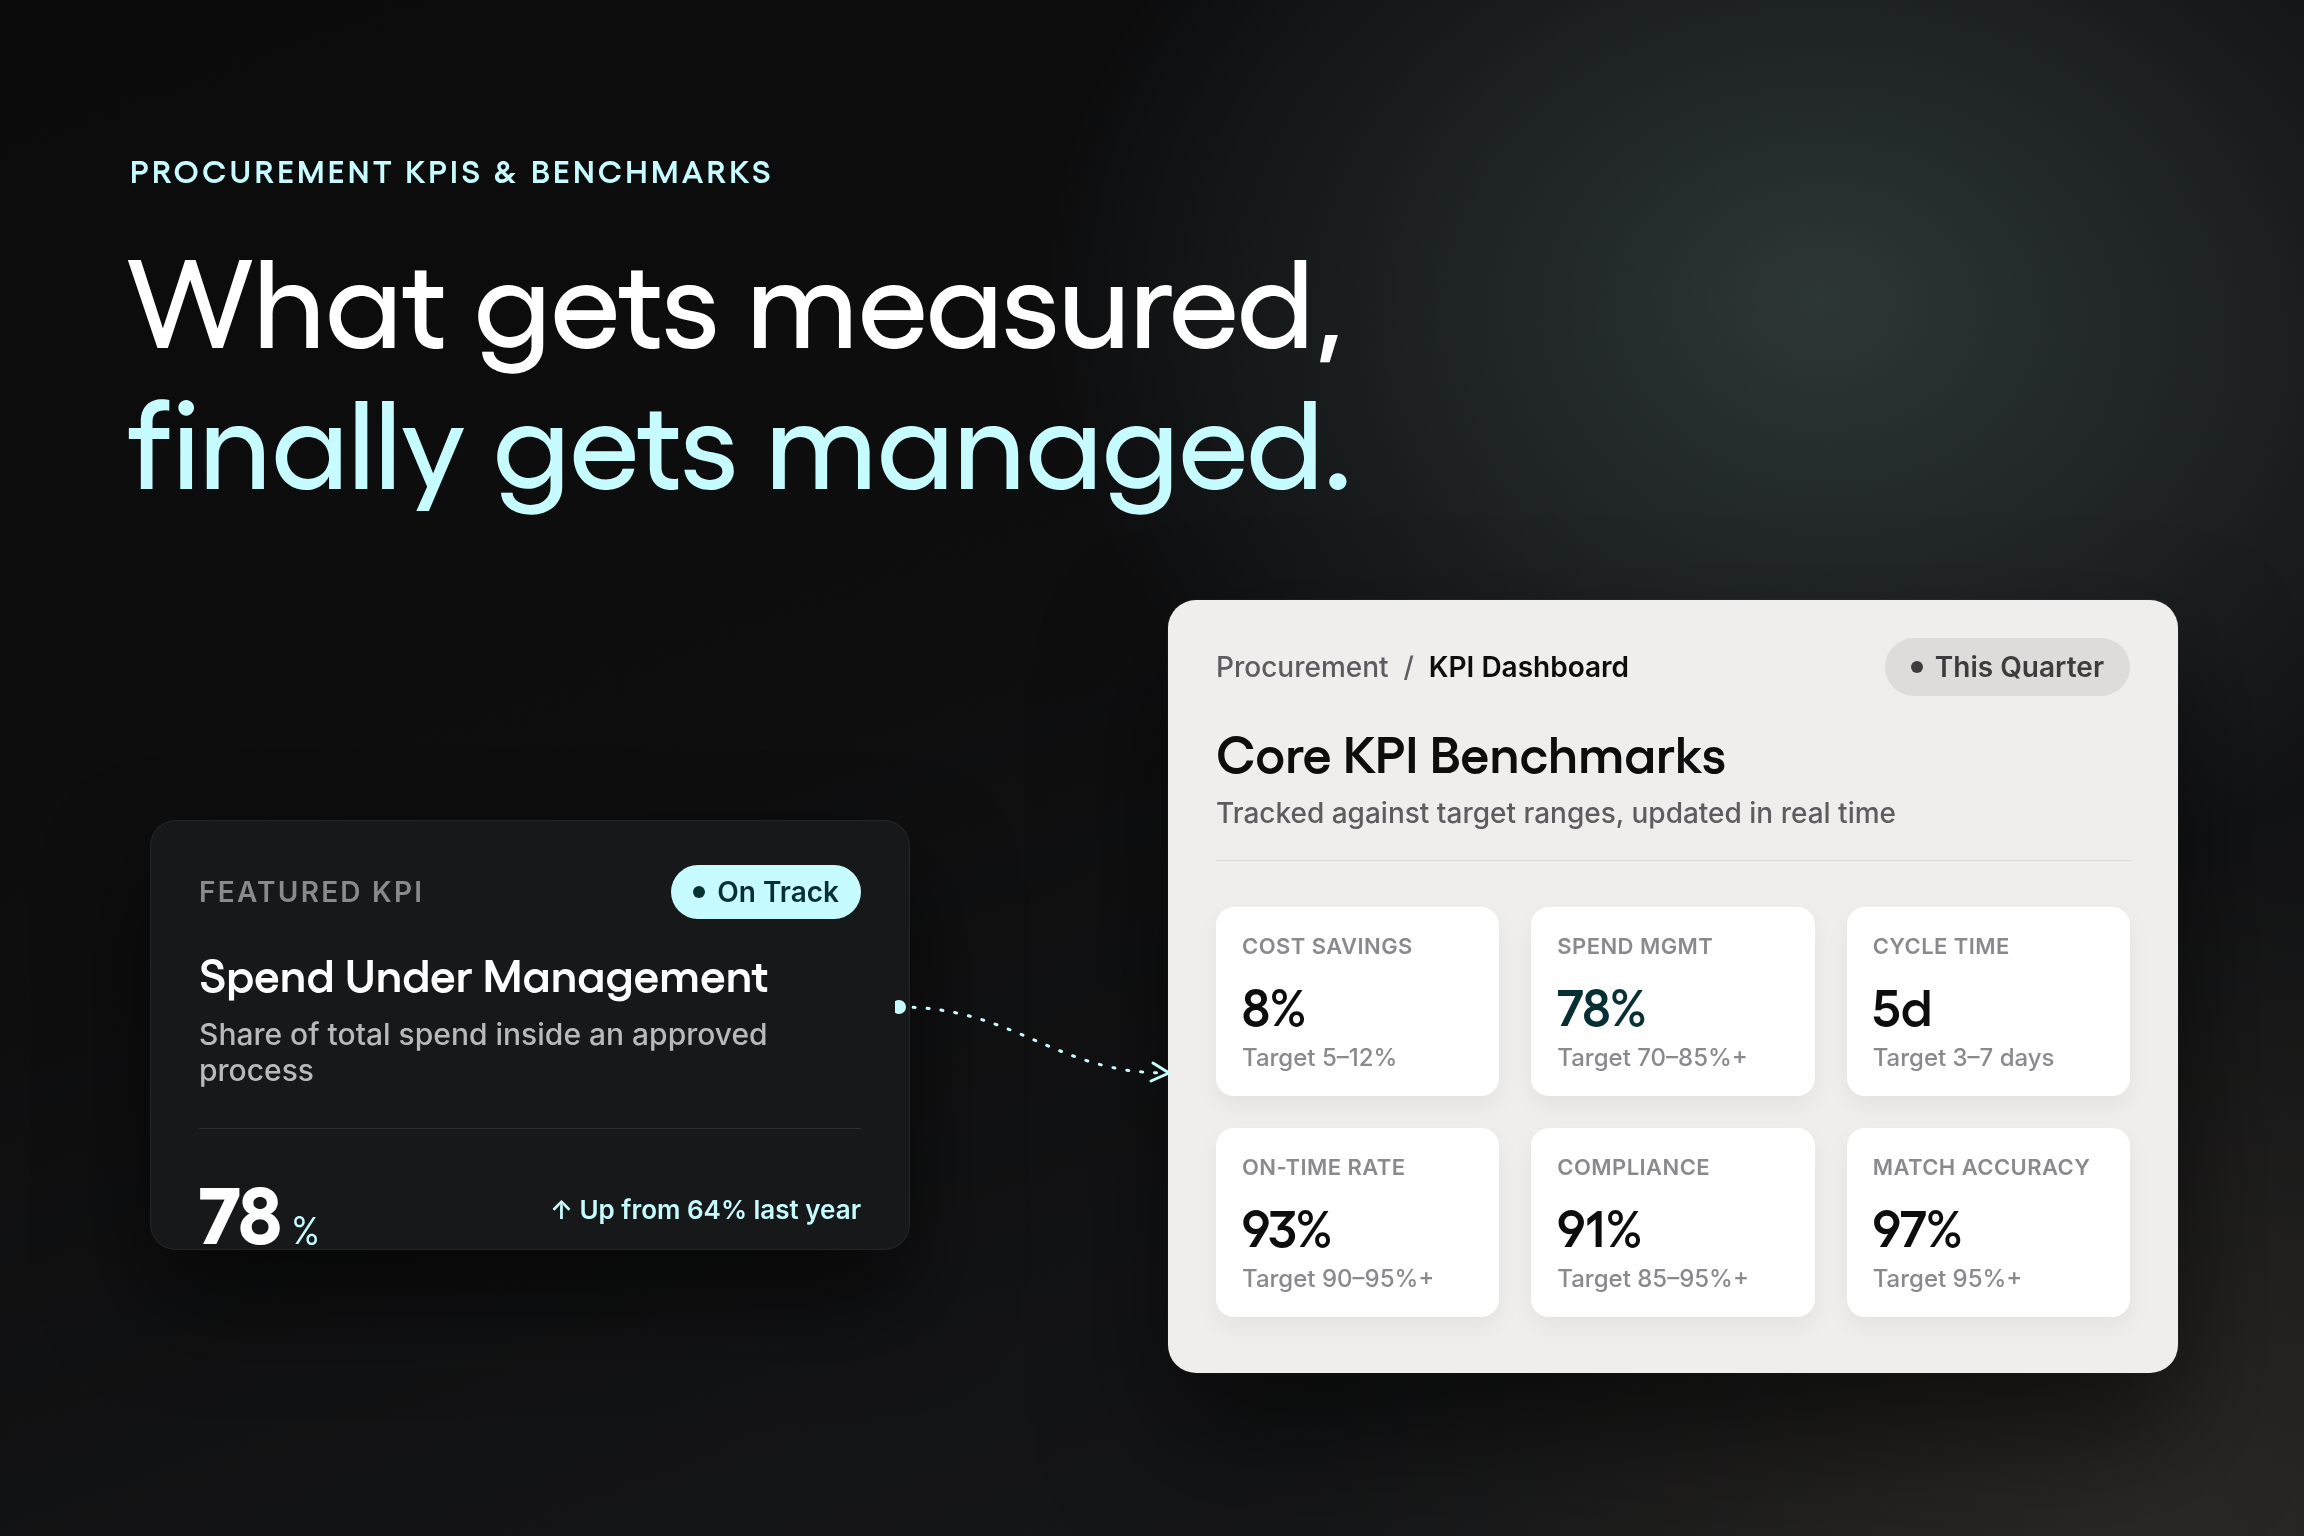
Spend under management (SUM) is the percentage of total organizational spend that goes through an approved purchasing process, with visibility, approval, and a purchase order behind it. The rest is either maverick spend, meaning purchases made outside the process, or spend that hasn't been brought into procurement's view yet, like a subscription renewed automatically on a company card.
A higher spend-under-management percentage generally means greater negotiating leverage, more consistent supplier terms, and fewer surprises for finance. Tradogram's spend management tools give budget owners a way to see committed spend before it becomes an invoice, giving finance real-time visibility into what's been committed rather than only what's already been paid, which is usually the fastest way to grow this number without adding new approval steps.
For example: Maverick spend rate tracks the percentage of purchases made outside the approved process, effectively the inverse of spend under management and a useful number to watch alongside it.
7. Contract compliance and regulatory compliance
Contract compliance tracks how often purchases use the negotiated rate and terms your organization already has in place, rather than buying off-contract at list price. Regulatory compliance covers the documentation, approvals, and audit trail an organization needs for its industry, whether that's a government funder, a healthcare regulator, or a standard internal audit.
Both matter because the gap is usually invisible until an audit or a variance report exposes it. Procurement and accounts payable benchmarking research suggests that 7% to 15% of procurement transactions at a typical mid-sized organization require some form of manual correction or exception handling, and a meaningful share of that stems from missing documentation or an approval that should never have been skipped. Centralized contract management, which consolidates renewal dates and supplier documents in a single system, makes it easier to catch compliance gaps before they become audit findings.
For example: Contract compliance rate monitors the percentage of organizational spend that flows through pre-negotiated contracts rather than off-contract purchases, making it one of the clearest early signals that a negotiated agreement isn't actually being used.
8. Budget deviations
Budget deviation is a core cost-control KPI that compares actual spending to the budget for a category, project, department, or the company as a whole. The goal isn't zero deviation. Budgets are estimates, and a department that never deviates is either sandbagging its forecast or not spending enough to do its job.
The real goal is catching a deviation early enough to protect cash flow and financial health. That means looking at committed spend, meaning approved requests and purchase orders not yet invoiced, not only what's already been paid. A department can look within budget and still be about to overspend once those commitments come due. Budget and spend control tools that show committed spend alongside actual spend make this KPI useful in the moment, not in hindsight.
For example: Budget variance percentage measures the difference between actual and budgeted spend as a percentage of the total budget for a category, department, or project, which turns a raw dollar gap into a number you can compare across teams of different sizes.
9. Accounts payable variations
Accounts payable variations compare what was ordered, what was received, and what was invoiced. When those three numbers don't match, the result is a duplicate payment, a missed volume discount, an overstock nobody noticed, or an invoice paid for goods that were never delivered, all of which quietly drain cash flow. Left unmanaged, these variations also tend to show up later as disputed invoices with the supplier, which takes more time to resolve than catching the mismatch upfront.
This is where three-way matching earns its keep: comparing the invoice against the purchase order and the receiving record before payment goes out, not after. Invoice matching software can flag mismatches automatically, rather than relying on accounts payable to catch them during manual review.
For example: Invoice match rate, sometimes called three-way match rate, tracks the percentage of invoices that match their purchase order and receiving record without exception before payment, the number that shows whether three-way matching is actually catching problems.
The ranges below are common starting targets many industry leaders and growing procurement teams use, not universal standards or a guarantee for any specific organization. Treat them as a baseline to adjust once you know your own category mix and purchasing volume.
KPI tracking best practices
A KPI dashboard is only as good as the discipline behind it. A few practices separate the teams that actually use their procurement metrics from the ones that build a report once and let it go stale.
Assign an owner to each KPI. A number nobody owns doesn't get acted on when it moves in the wrong direction, which is why ownership matters more for your most important KPIs than for a nice-to-have metric. Review on a fixed schedule, not only when something goes wrong. Monthly works for most of the KPIs above, and a quarterly review is usually enough for benchmarking and category trends. Reviewing on a schedule also makes it easier to monitor progress and identify areas that need a closer look, rather than waiting for a budget surprise to reveal them.
Automate the collection where you can. Manually pulling purchase order, receiving, and invoice data into a spreadsheet every month is exactly the kind of work that introduces the errors these KPIs are meant to catch. And connect every number to a decision: that's the real difference between plain metrics and smart KPIs, not just how carefully each one is measured. Sharing the dashboard with finance and department leaders turns performance tracking into stakeholder collaboration instead of a private scorecard, which matters more than chasing operational excellence for its own sake.
I like the levels of control available. The approvals and the activity tracking. It has made things run much smoother. We have likely improved our procurement process 100% because of Tradogram.
Adriana Ruiz, Technical America
Direct vs. indirect procurement KPIs
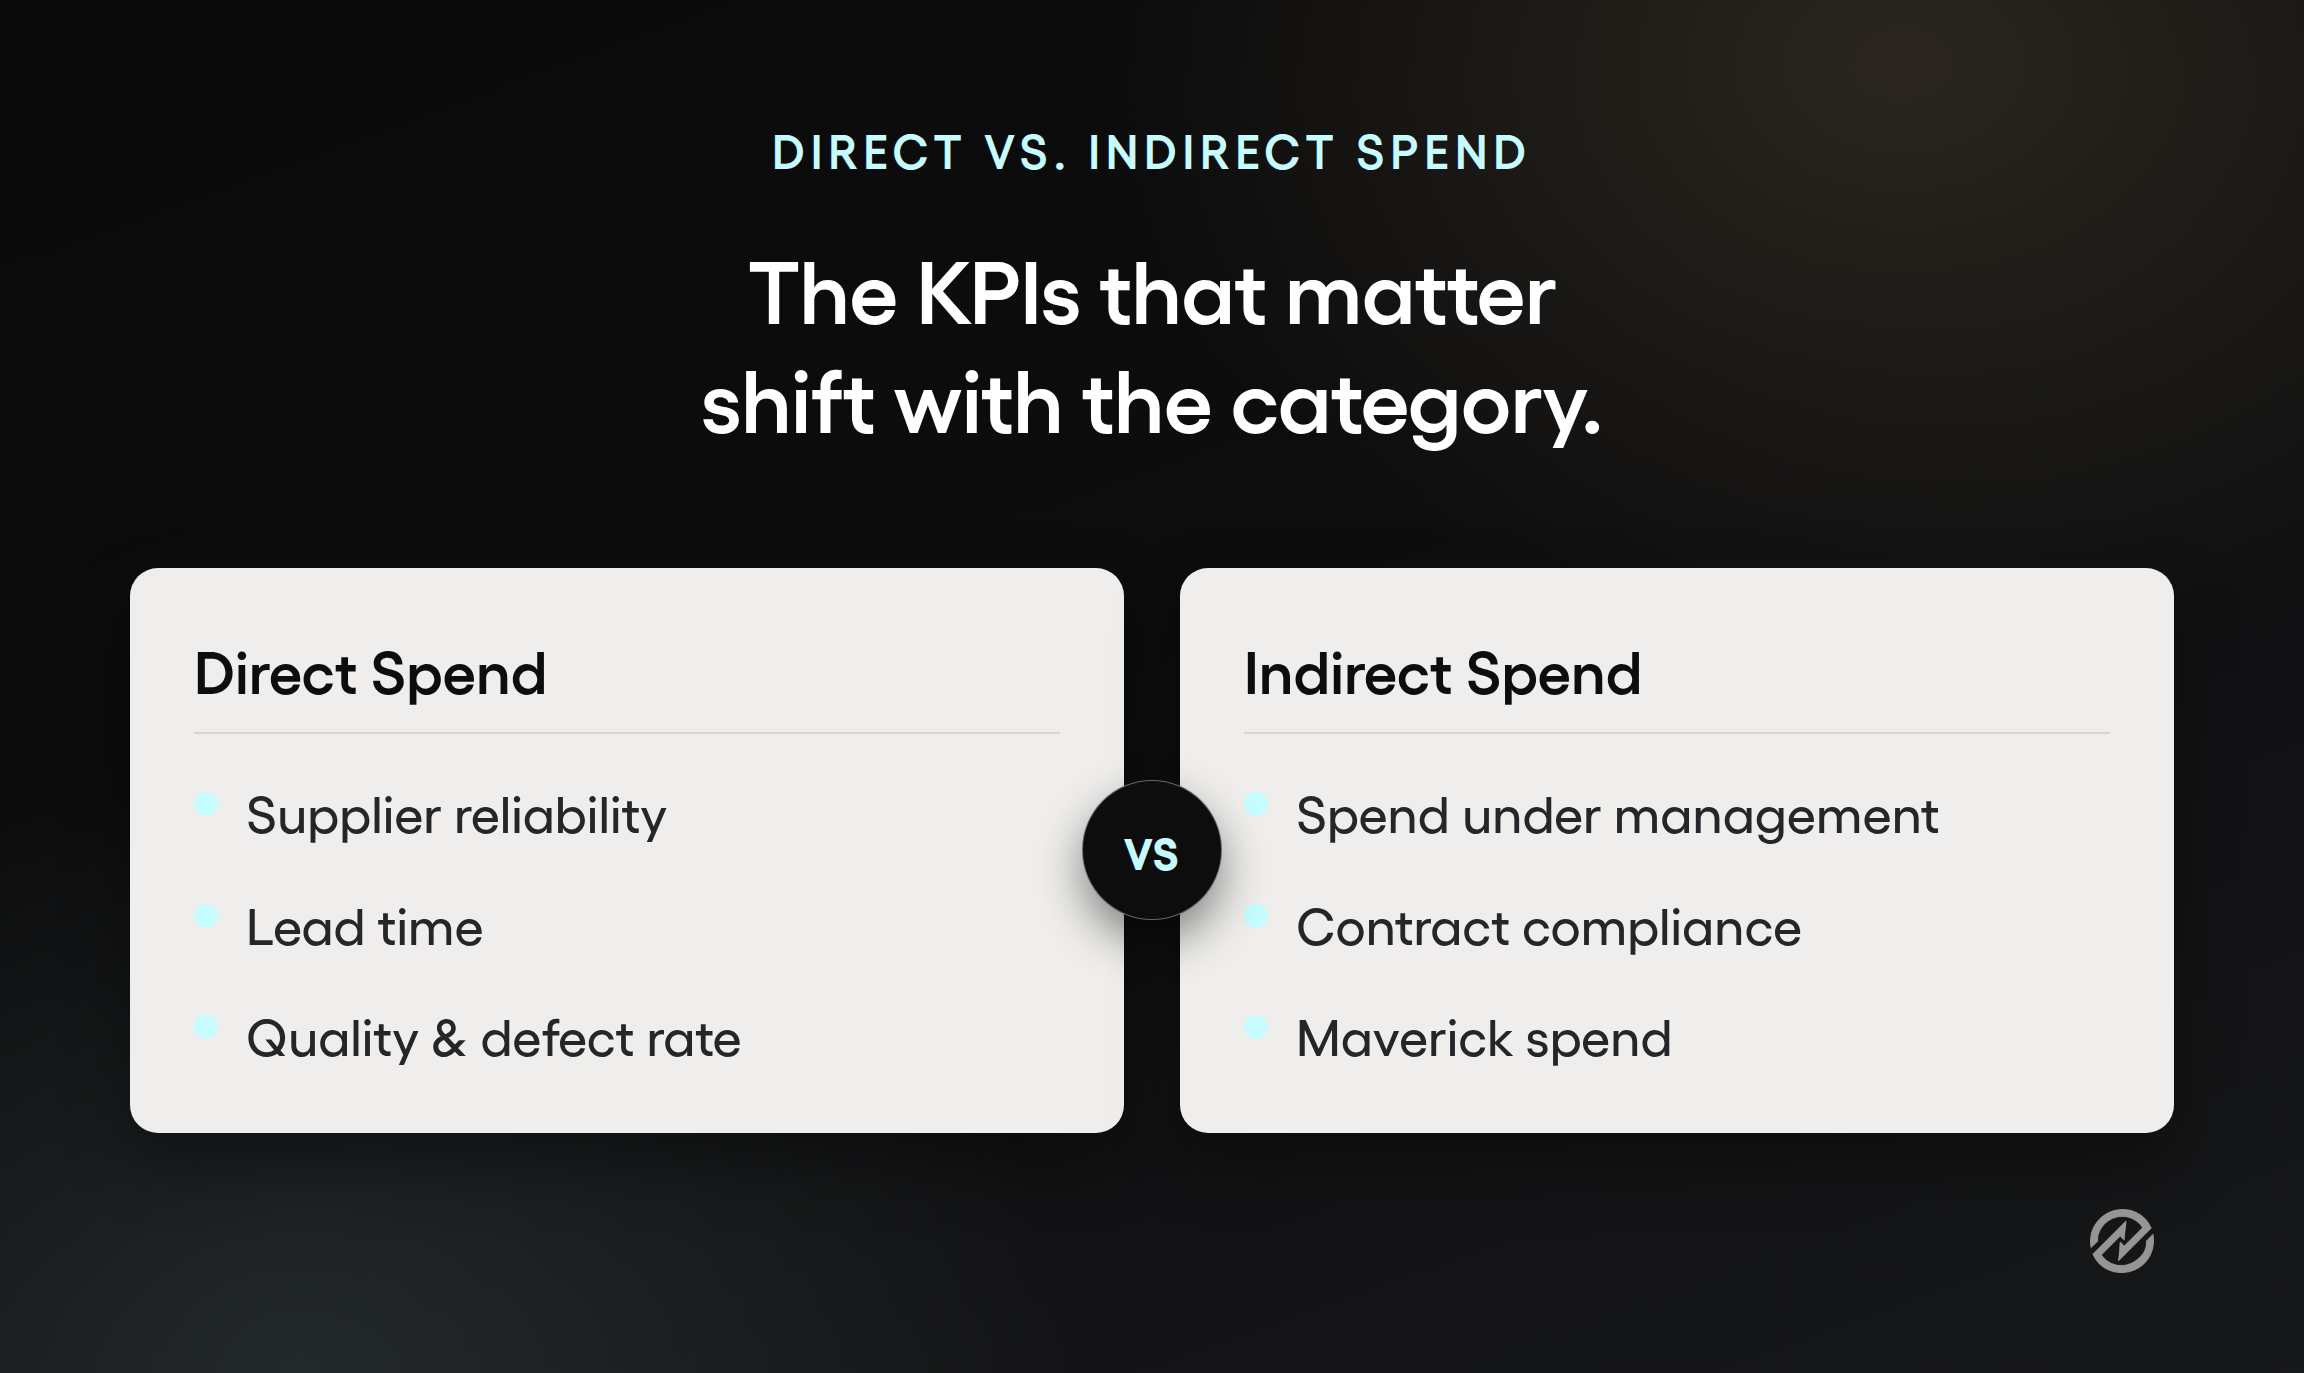
Direct procurement covers the materials and services that go directly into what your organization sells or delivers: raw materials for a manufacturer, medical supplies for a hospital, course materials for a school. Indirect procurement covers everything that keeps the organization running without becoming part of the product or service itself, such as office supplies, software subscriptions, facilities, and professional services.
The KPIs that matter shift with the category. Direct spend tends to prioritize supplier reliability, lead time, and quality, because a delay or defect can stall production, delay delivery, and ultimately affect customer satisfaction further downstream. Indirect spend tends to prioritize spend under management and contract compliance because indirect categories are where maverick spend and duplicate subscriptions often hide. Tracking both sets separately, rather than blending them into one procurement dashboard, makes it easier to see which category actually needs attention.
Procure-to-pay KPIs
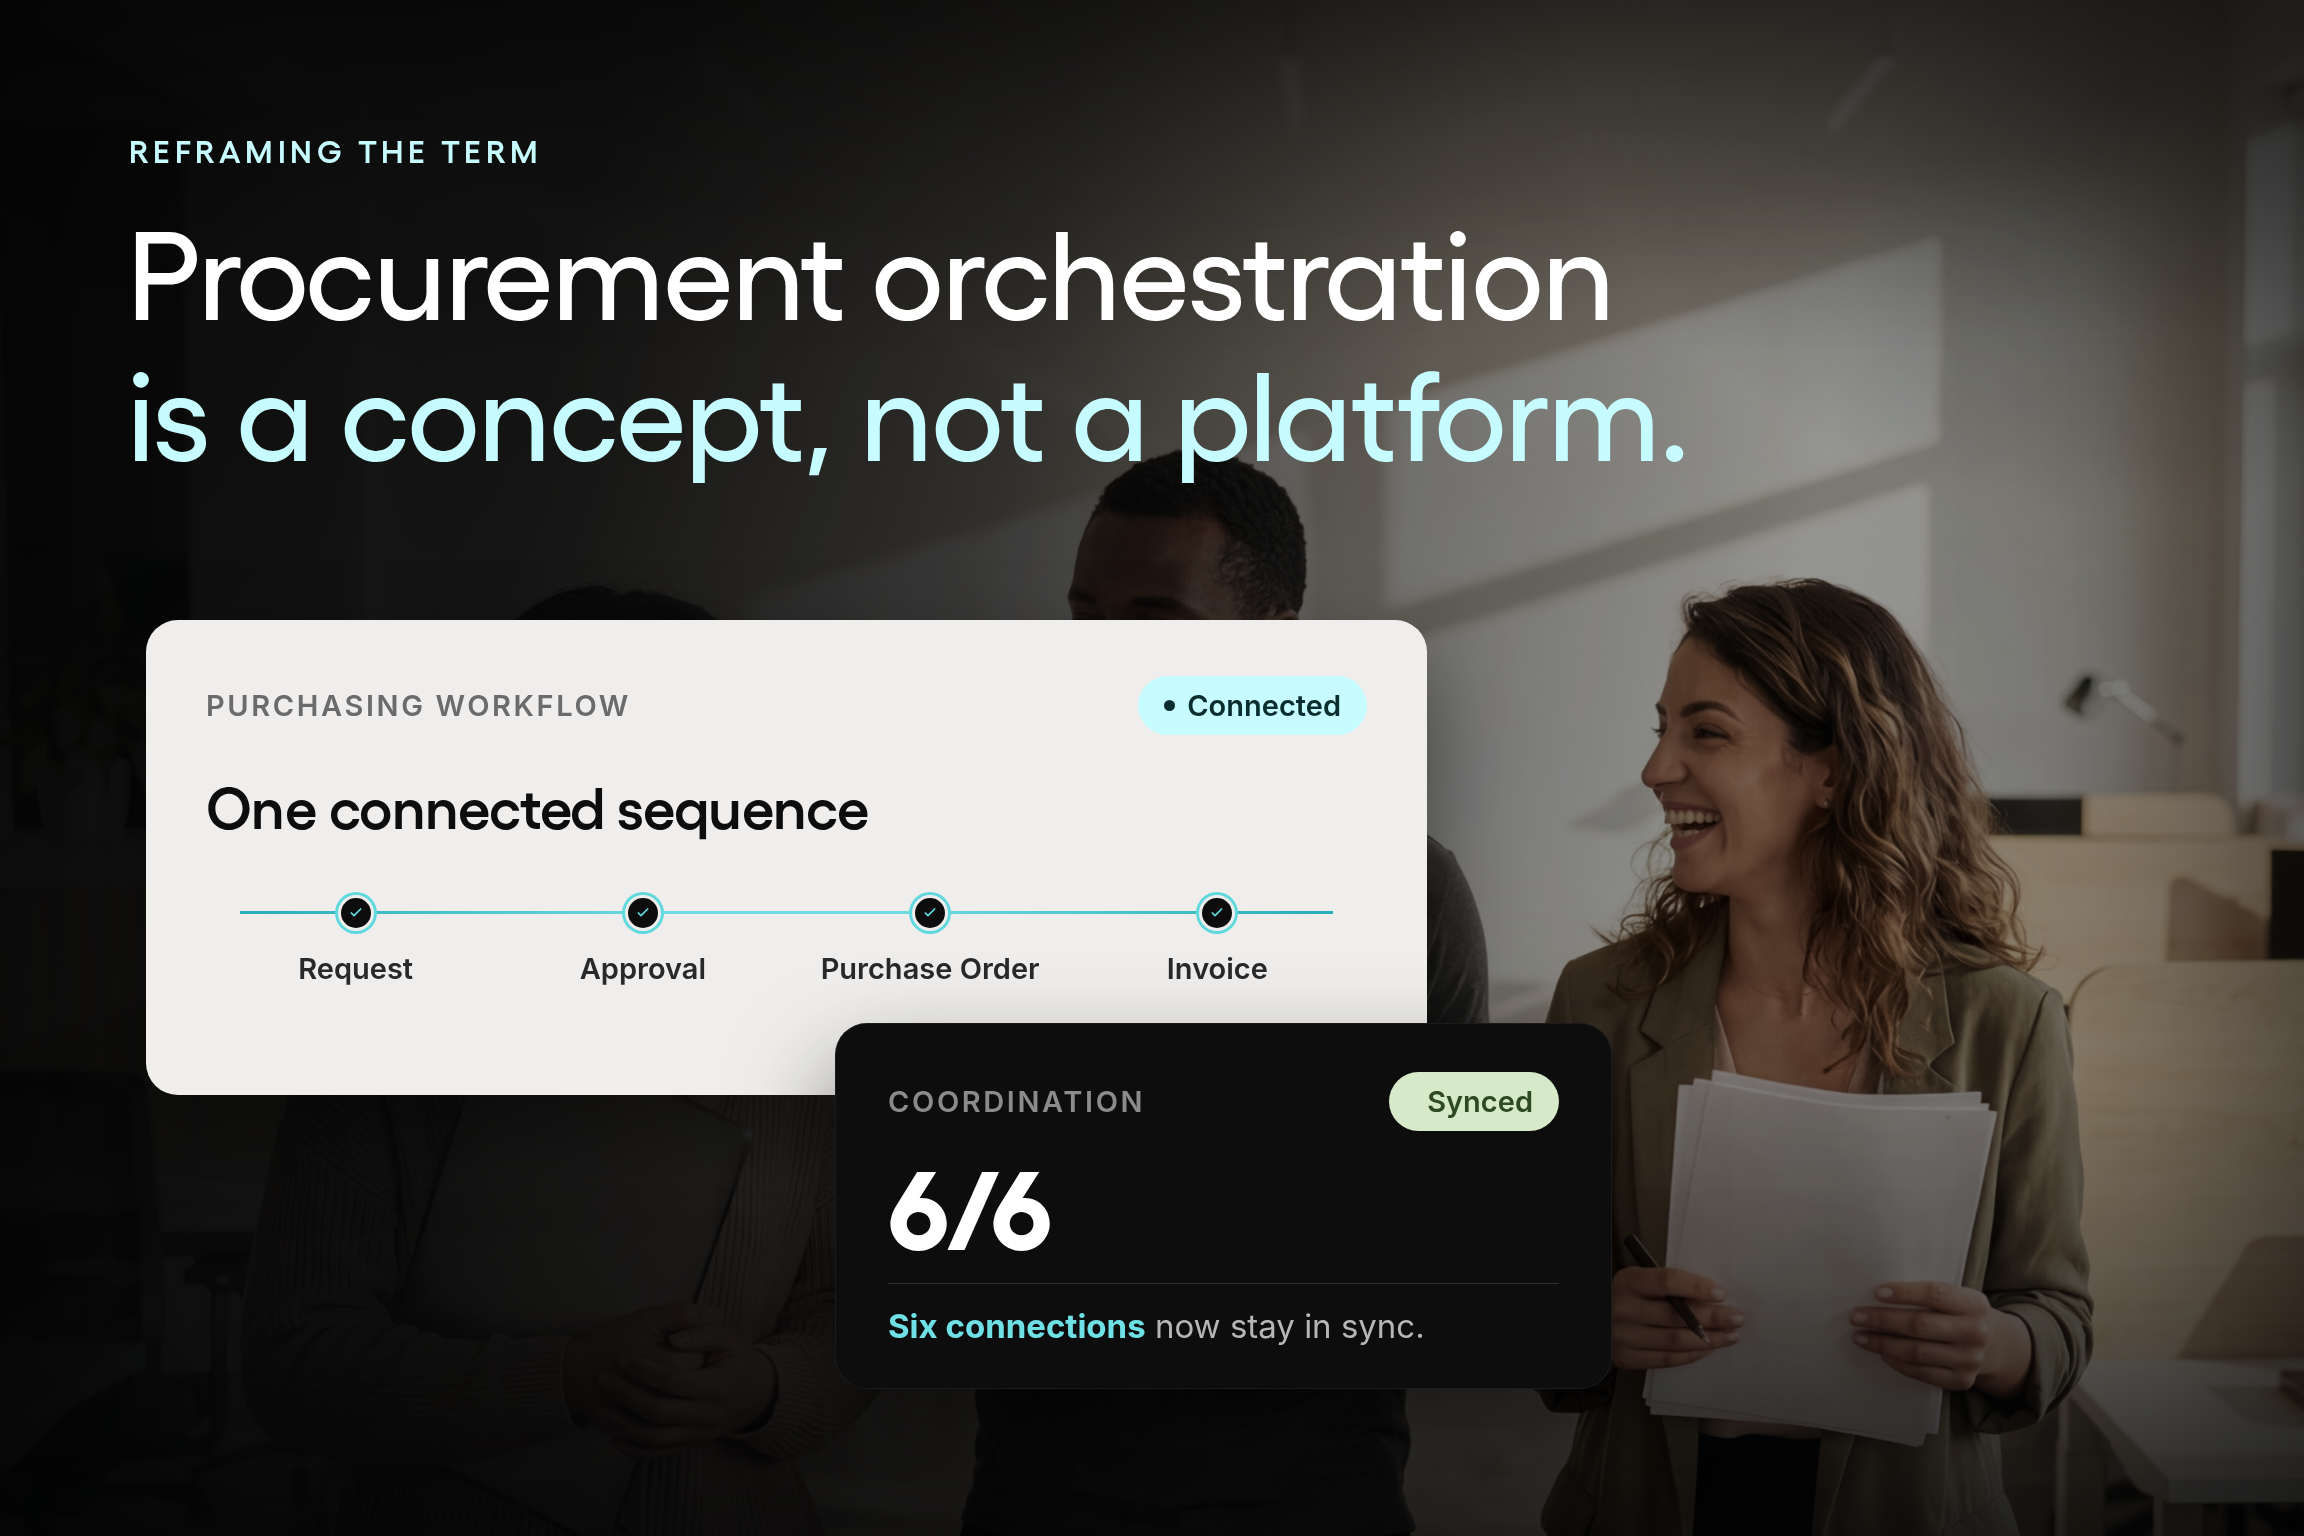
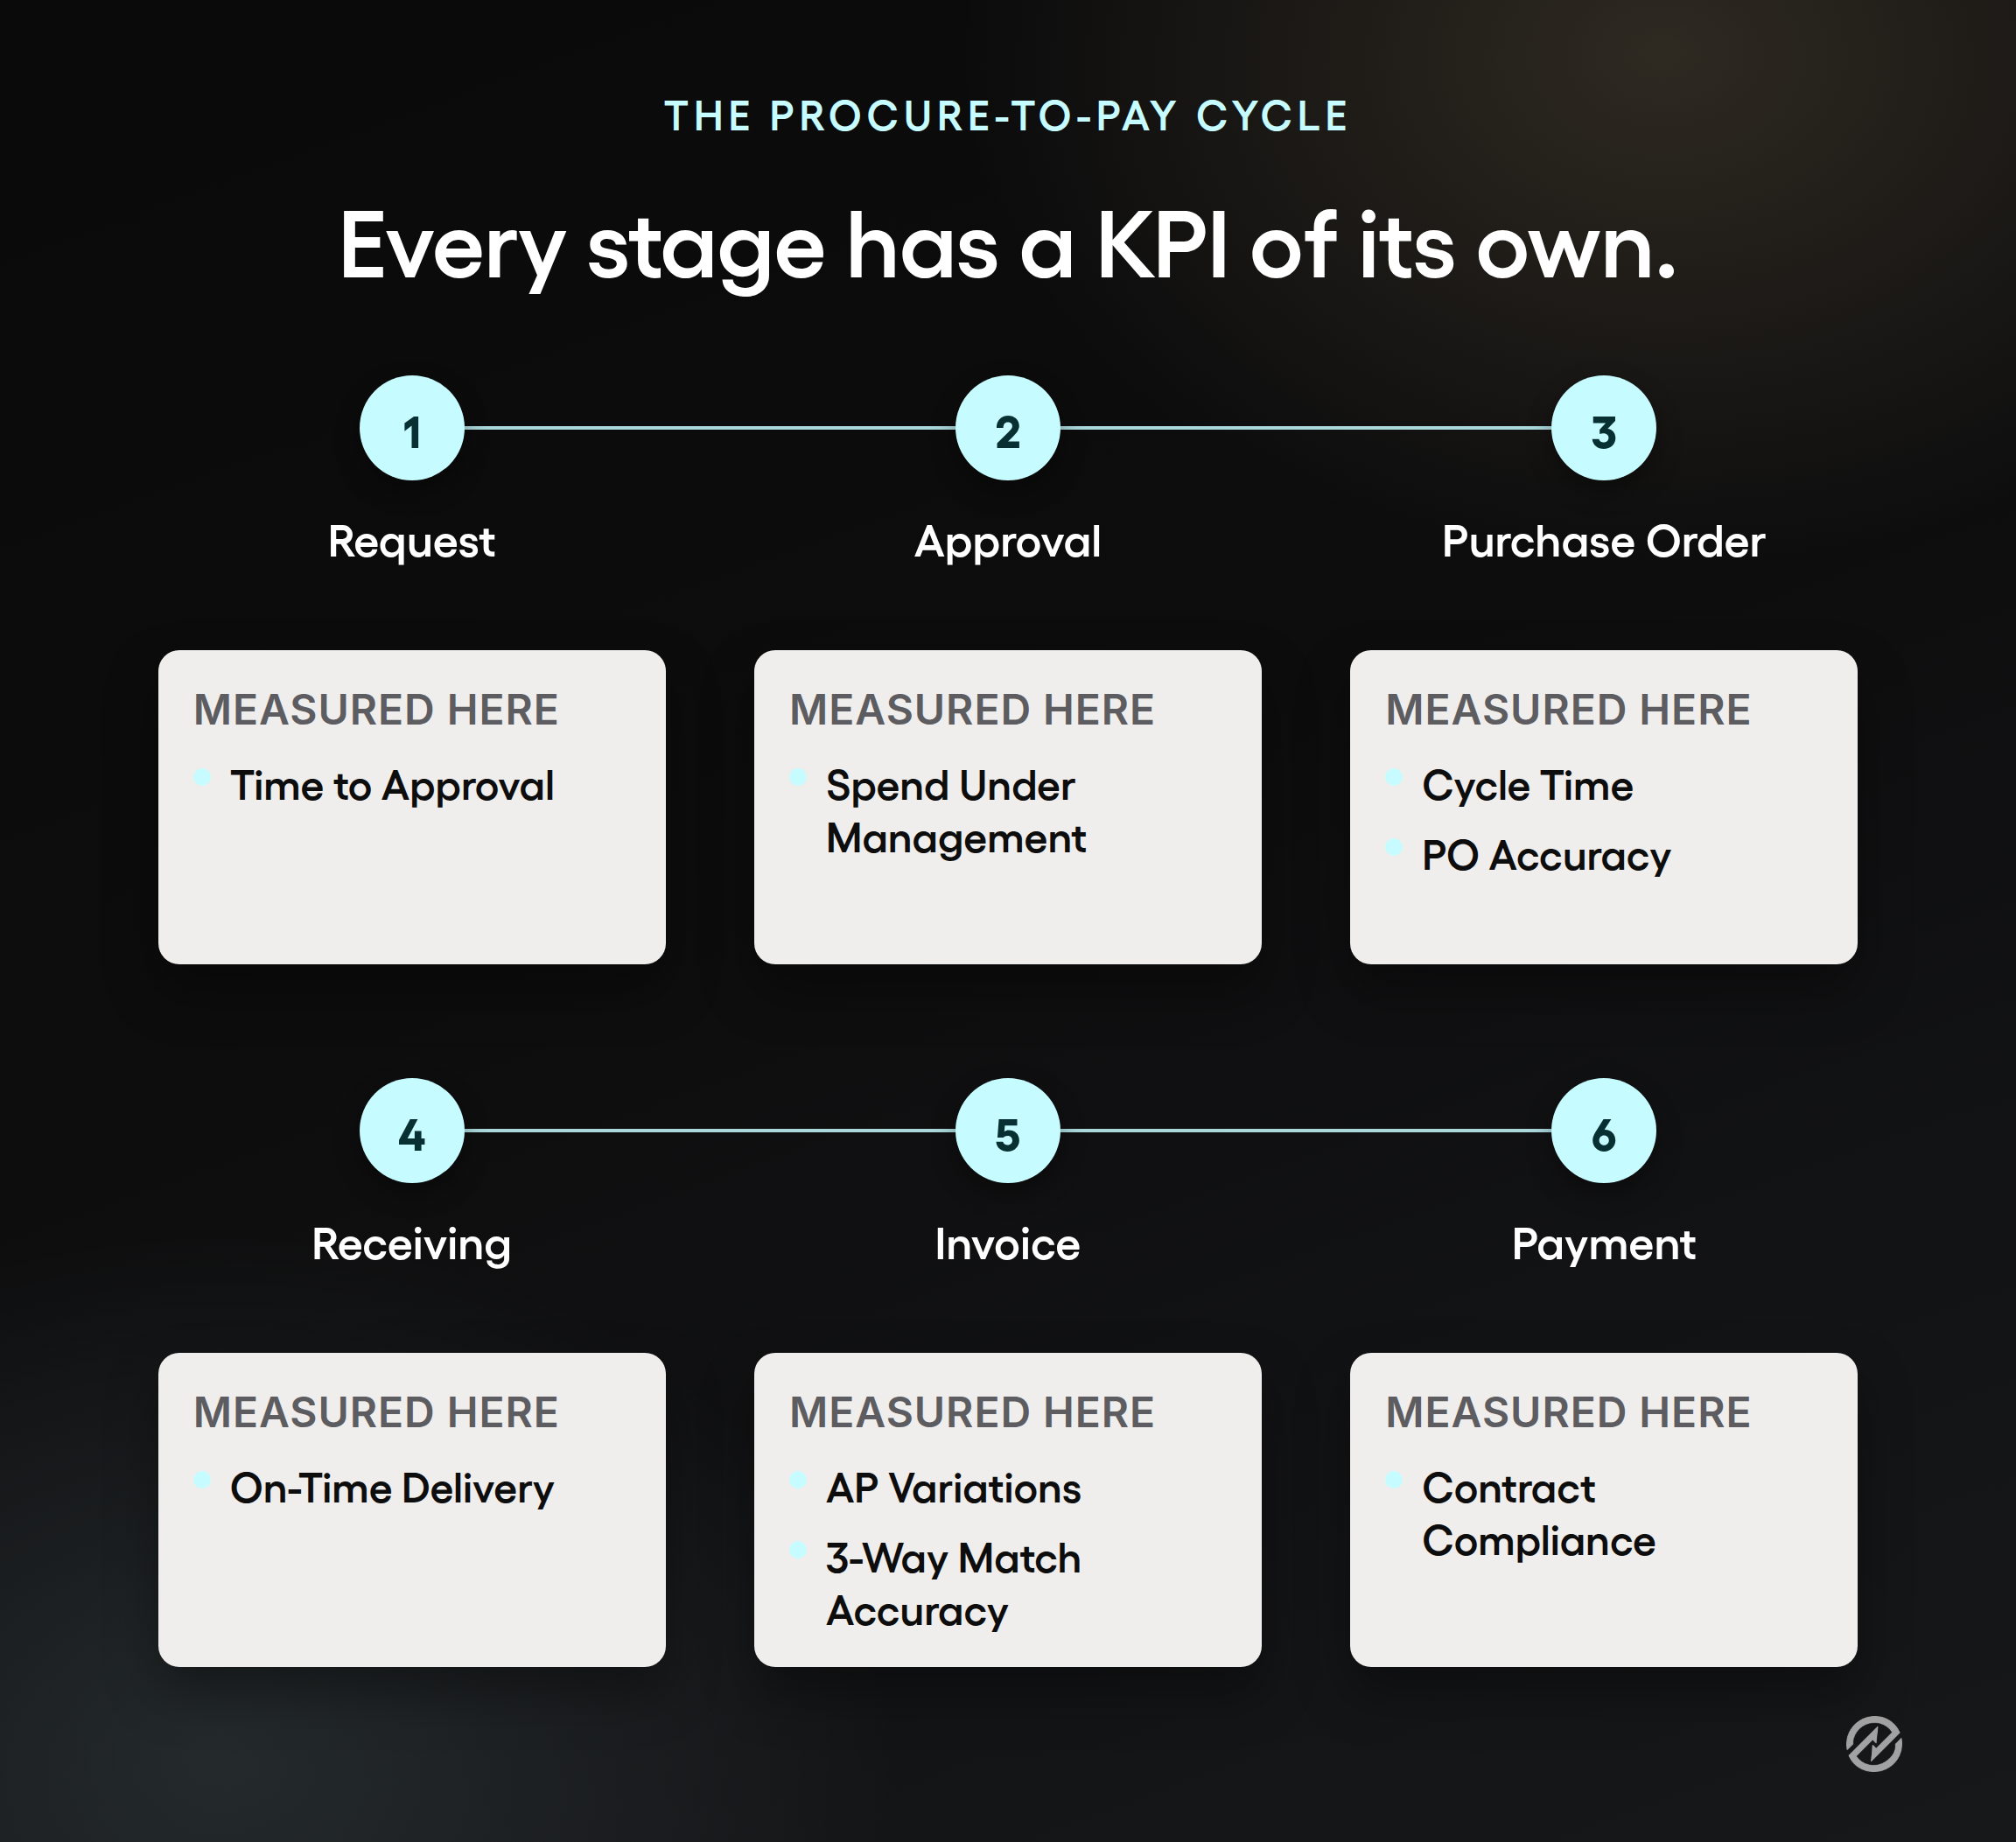
Procure-to-pay (P2P) is the full cycle from purchase request through payment: request, approval, purchase order, receiving, invoice, and payment. Measuring KPIs at each stage, rather than only at the end, makes it much easier to find where a purchase is actually getting stuck.
A few P2P-specific KPIs are worth adding to the ones already covered above: the percentage of invoices processed without a manual touch, the time from purchase order approval to supplier acknowledgment, and the percentage of purchases that went through a completed requisition and approval before any commitment was made. That last one is really spend under management measured at the transaction level, and it's often the clearest signal of whether the P2P process is actually being followed or just documented. Measuring KPIs at each stage, rather than only at the end, supports data-driven decisions instead of a single end-of-quarter guess. Procure-to-pay software connects all these stages, so the KPI comes from a single connected record rather than five separate systems.
How to track procurement KPIs without spreadsheets
Most of the KPIs in this guide can be calculated in a spreadsheet. The problem isn't the math. It's keeping the inputs current enough that the number still means something by the time someone reads it. Purchase order data lives in one file, receiving lives in an inbox, and the invoice arrives three weeks later in a completely different system. By the time everything gets reconciled by hand, the KPI is a historical record, not something anyone can act on this week.
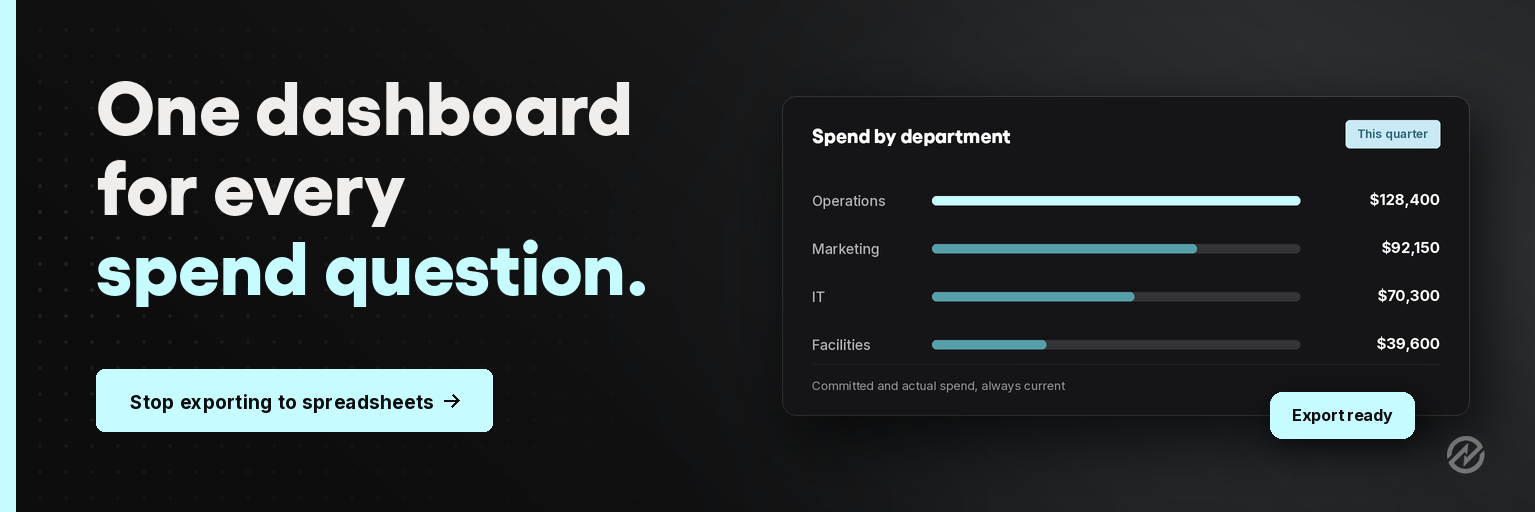
Procurement reporting built on connected records, rather than a monthly export, works differently. Spend under management, supplier performance, cycle time, and budget deviation can all pull from the same set of requests, approvals, purchase orders, receiving records, and invoices, instead of five spreadsheets that need to agree with each other.
That's what Tradogram's procurement reporting is built to do: turn purchasing and spend data that already lives in the system into actionable insights your team can actually trust, without a manual reconciliation step at the end of the month.
If you want to see what that looks like against your own KPI list, a product tour is a low-pressure way to find out.
Where to go next
Picking the right procurement KPIs is the first step. Reviewing them consistently and connecting each one to an actual decision turns a dashboard into a management tool rather than a reporting exercise that nobody opens until the quarterly meeting.
For a closer look at how to choose, calculate, and benchmark the KPIs that matter most for spend management specifically, download Tradogram's complete guide to the essential KPIs for better spend management.