

The first time it happened, it was a favor. A finance analyst pulled a spend extract out of the ERP, cleaned up the supplier names by hand in a spreadsheet, and handed the result to procurement in time for a board paper. It took her two days. It answered the question that was asked.
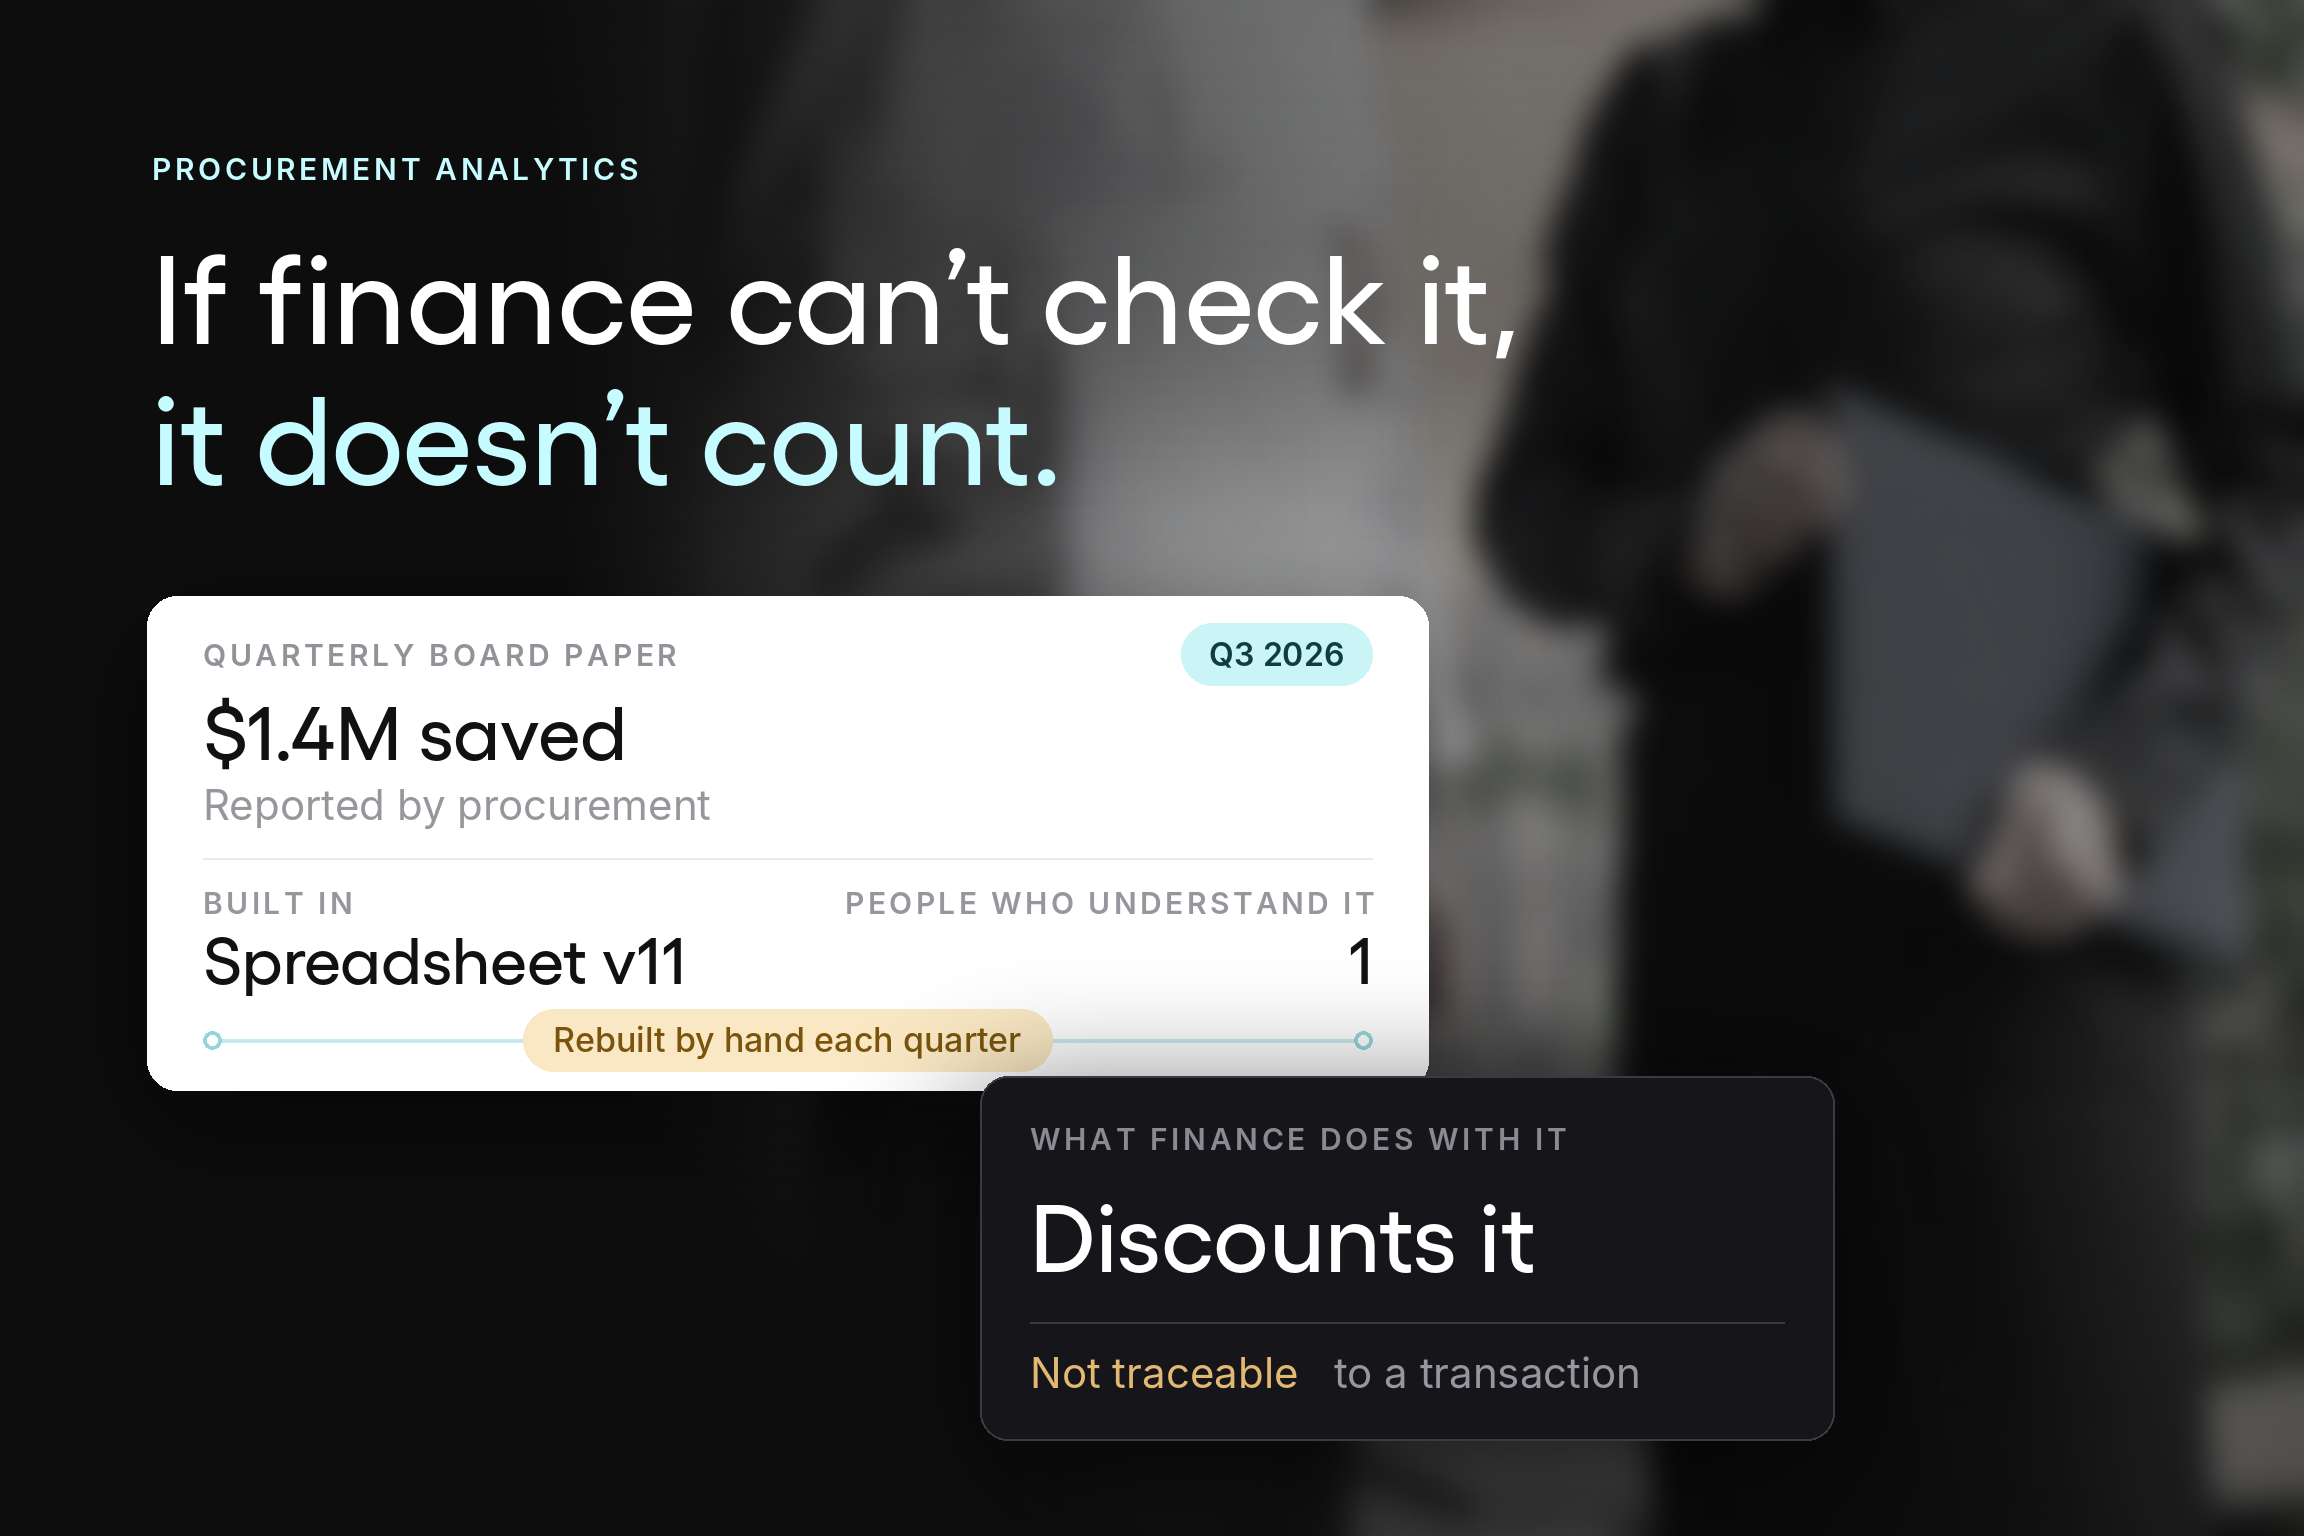
Four years later, that spreadsheet is the reporting system. The file name carries a version number and a date. Two people understand how the supplier mapping works, and one of them has left the company. Every quarter someone rebuilds it, and every quarter the board receives a savings number that cannot be traced back to a transaction.
At Tradogram, we have helped thousands of organizations digitize their purchasing, and this is among the most common patterns we see: a workaround built for one deadline that quietly became the operating model. The cost is not the two days a quarter. The cost is that procurement has been measuring itself in a language finance cannot verify, and every claim it makes gets discounted at the door.
Procurement analytics exists to close that gap. Its job is to make procurement's contribution legible to the people who allocate capital. This guide covers what procurement analytics is, the four questions it answers, why most organizations never get past the first one, what data it runs on, and what it takes to build a capability that survives contact with a finance review.
What is procurement analytics?
Procurement analytics is the practice of collecting, classifying, and analyzing purchasing data to inform decisions about what an organization buys, from whom, at what price, and on what terms.
The definition is uncontroversial. What it means in practice is more contested, because two organizations can both claim to have it while doing entirely different things.
At one end, procurement analytics means a monthly spend report circulated to category managers. At the other, it means a governed data layer that connects purchase orders, invoices, contracts, and supplier records, refreshed continuously, classified consistently, and queryable by anyone who needs an answer. Both are often described in board papers with the same phrase.
The distinction that matters is whether the analysis changes decisions. A spend report that changes nothing is a cost. Analysis that redirects a category strategy, flags a supplier before they fail, or gives procurement a defensible position in a budget conversation is a capability. Procurement analysis becomes procurement analytics when it is reliable enough to act on without someone checking it first.
One adjacent term needs separating out. Spend analysis is a subset. Spend analytics answers where the money went and with whom. Procurement analytics is broader, covering supplier performance, contract compliance, process efficiency, risk, and the forward-looking questions that spend data alone cannot reach.
The four questions procurement analytics answers
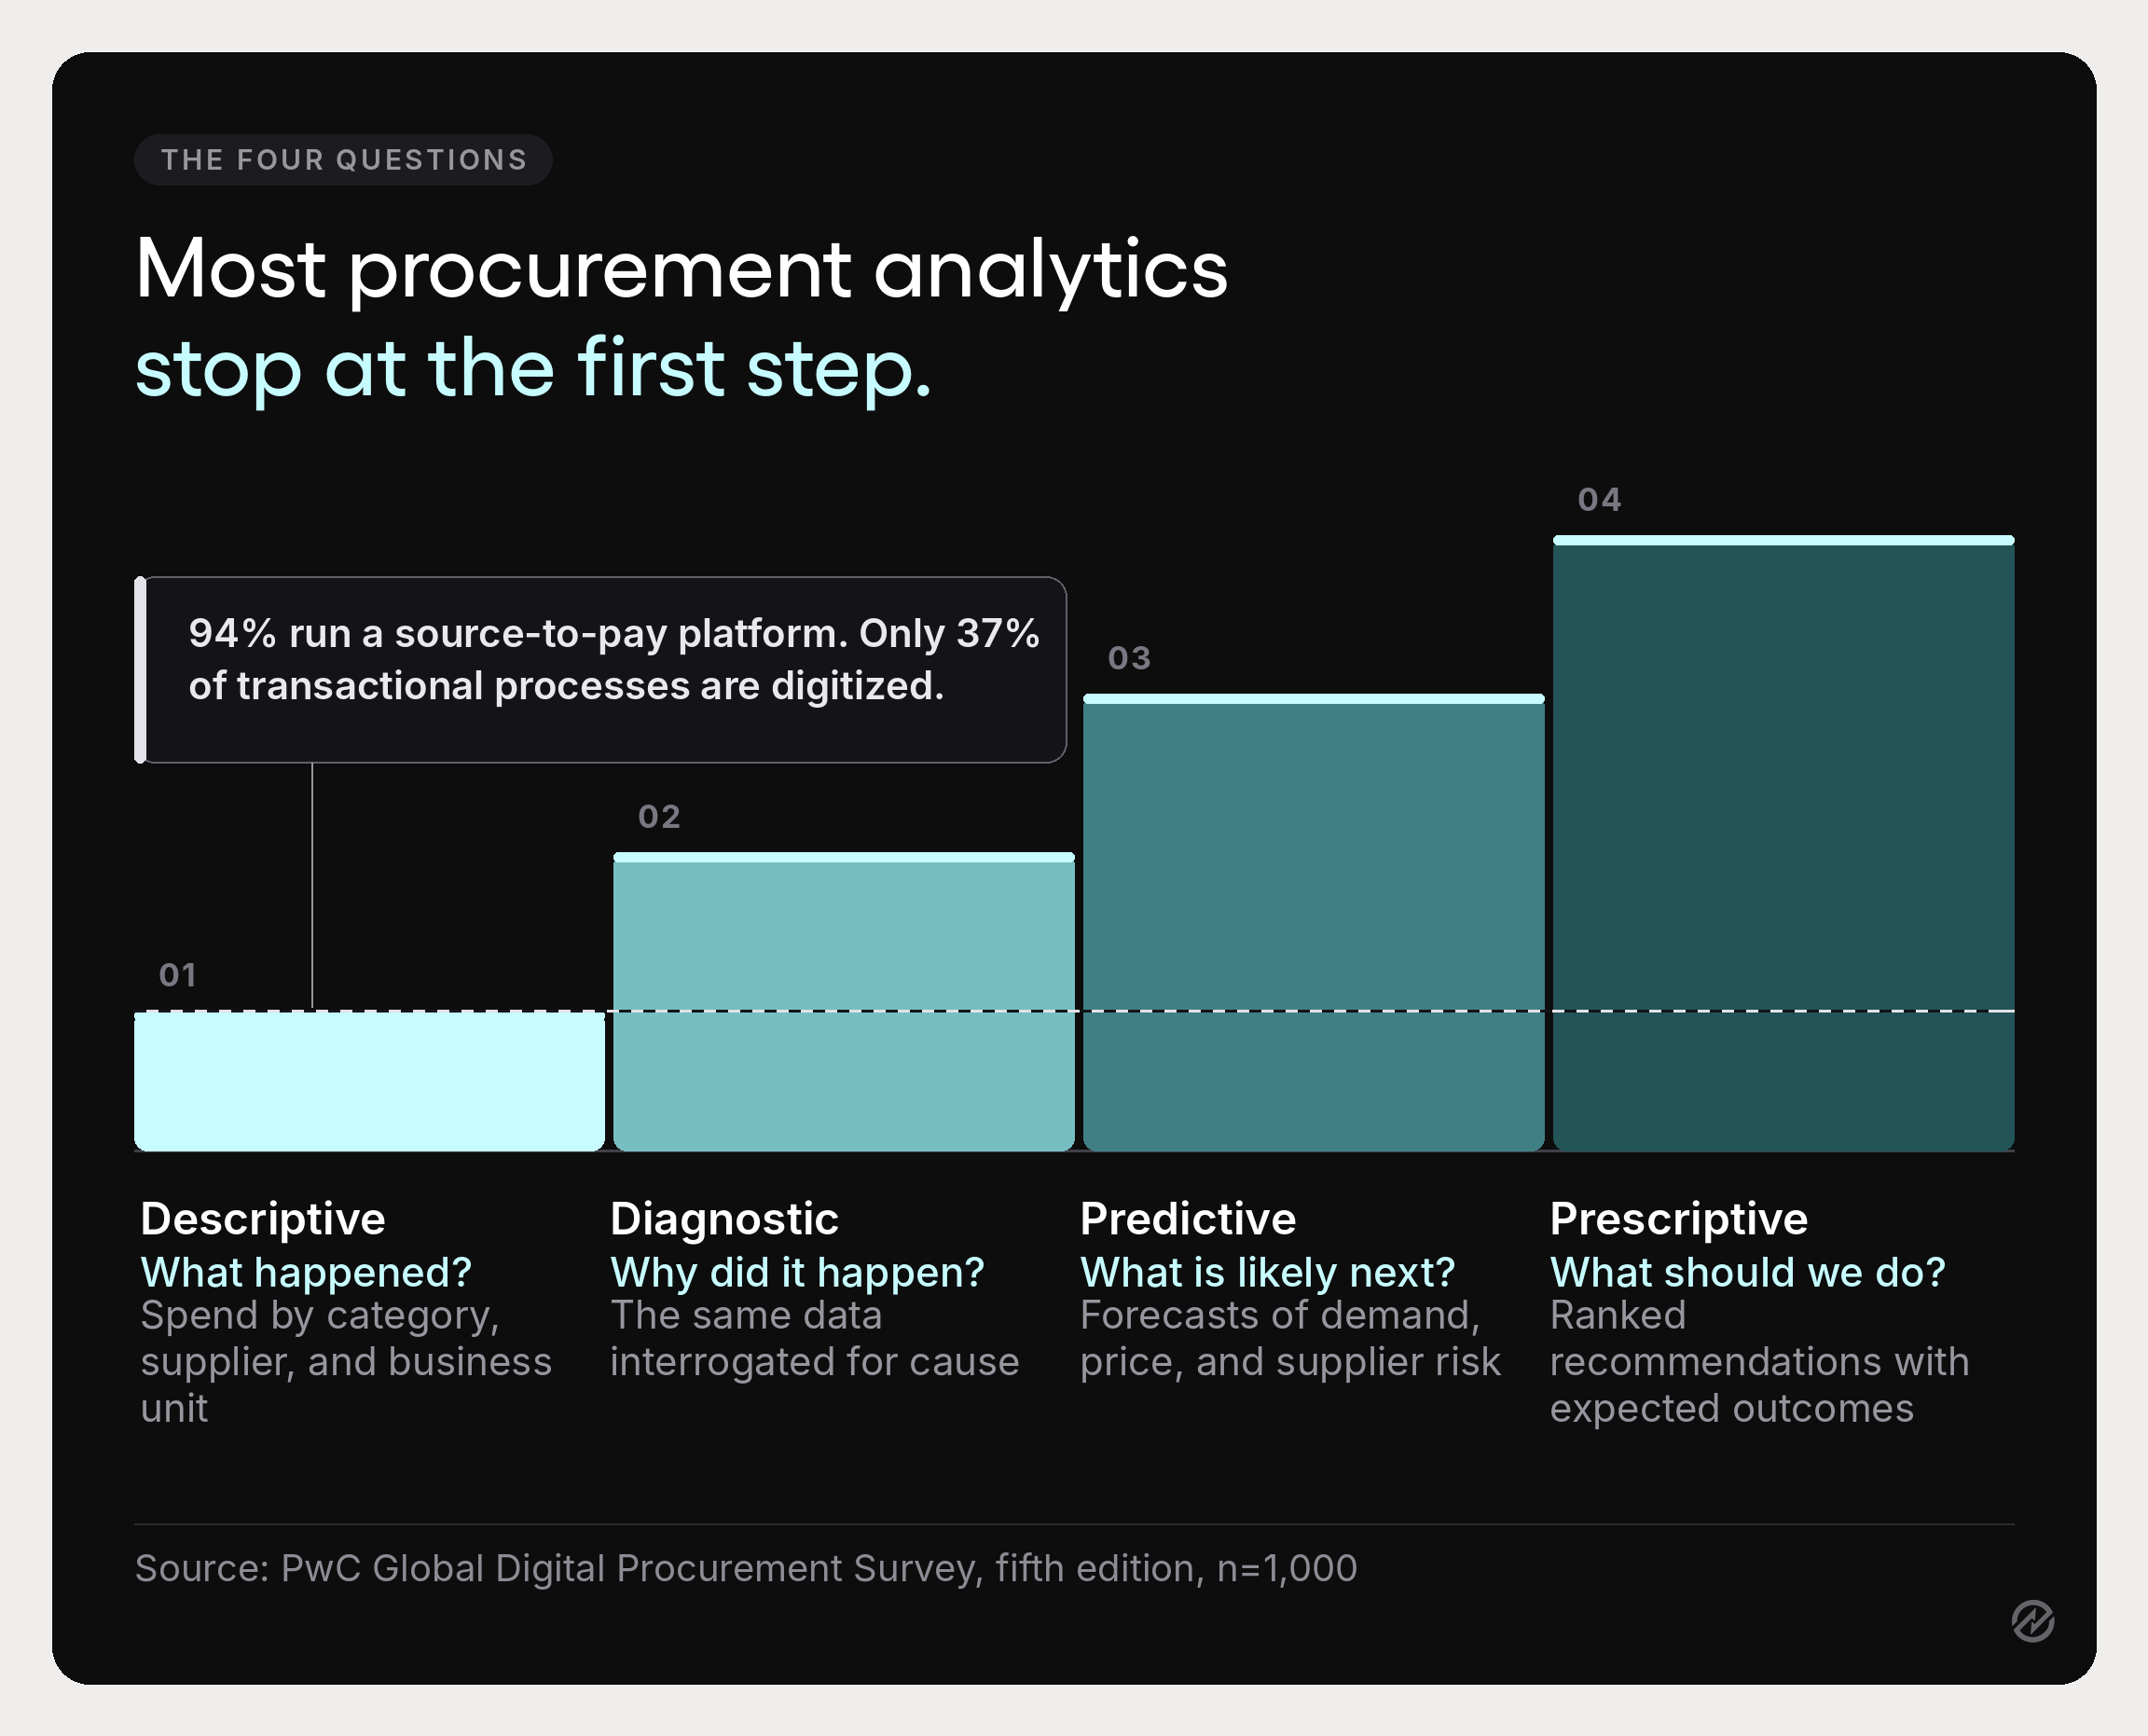
The four types of procurement analytics are usually listed as a taxonomy. They are more useful as a sequence of questions, each harder than the last and each dependent on the one before it.
Descriptive analytics: what happened?
Historical data organized so it can be read. Total spend by category, by supplier, by business unit. Purchase order volumes, cycle times, contract coverage. This is the foundation, and for most organizations it is also the ceiling.
Diagnostic analytics: why did it happen?
The same data interrogated for cause. Why did this category's cost rise 12% when the market index rose 4%? Why does one business unit buy outside contracts more often than the rest? Diagnostic analytics is where analyzing procurement data starts to produce arguments.
Predictive analytics: what is likely to happen next?
Models applied to historical patterns and external signals to forecast demand, price movement, supplier risk, or delivery reliability. Predictive analytics is only as good as the classification underneath it, so organizations that skip the first two rungs get forecasts that are both precise and wrong.
Prescriptive analytics: what should we do about it?
Recommendations that combine predictive output with business rules and constraints, ranked by expected outcome. Consolidate these three suppliers. Bring this category forward in the sourcing calendar. Renegotiate before the index moves.
Here is the part that matters. Across the 1,000 organizations in PwC's Global Digital Procurement Survey, 94% were running a source-to-pay platform, but the average digitalization rate for transactional processes was only 44%. The platforms that could answer the harder three questions are largely already bought and mostly underused, and PwC points to user take-up as one of the most limiting factors.
Why most teams never get past the first question
The reason is almost never analytical talent. It is that the data underneath will not support a harder question.
Descriptive analytics is forgiving. A category total is roughly right even if 15% of the lines are misclassified, because the errors distribute. Diagnostic analysis is not forgiving. Ask why a category rose, and misclassification stops being noise and becomes the answer. Ask a predictive model to forecast from that same data, and it will forecast confidently from the noise.
The fragmentation is measurable. World Commerce and Contracting's August 2025 research found contract data spread across an average of 24 systems, with average value erosion of 8.6% across the life of a contract. That is one document type in one discipline. Purchasing data lives in one system, contract management in another, supplier records in a third, and no one owns the join.
Three specific conditions have to hold before a team can climb past descriptive:
Spend has to be classified consistently. Not perfectly, but consistently, and to a taxonomy the business recognizes. Two records for the same supplier under different names will defeat any analysis built on top of them.
The data has to refresh without a person. Analysis that depends on someone running a monthly extract will be as current as that person's calendar. Automated data collection turns a report into a capability.
Someone has to own it. Analytics maturity correlates less with the sophistication of procurement analytics platforms than with whether a named person is accountable for data quality. Organizations without that role see their classification degrade until someone notices the numbers no longer make sense.
None of that is glamorous, and it all comes before advanced analytics will repay the effort. Procurement leaders who invest in modeling before governance generally buy themselves a more expensive version of the same uncertainty.
The data procurement analytics runs on
Procurement analytics draws on internal and external data, and the two behave very differently.
Internal data sources
Internal data is everything your own systems already hold. Purchase orders, invoices, receipts, contracts, supplier master records, requisitions, and approval history. ERP systems hold most of it, procurement systems hold the rest, and the practical work of data extraction is usually less about access than about reconciling records that describe the same thing differently. Raw purchasing data is rarely analysis-ready. Classification, deduplication, and enrichment make it analysis-ready. That is the unglamorous majority of any analytics implementation.
External data sources
External data sources turn internal reporting into context. Commodity and market price indices tell you whether a supplier's increase tracked the market or exceeded it. Supplier financial health data tells you which critical vendors carry risk you cannot see in your own transaction history. Industry benchmarks tell you whether your cycle times are good or merely familiar.
There is a sequencing point buried in that.
Organizations routinely buy external market data before their internal records can support it, on the reasonable-sounding logic that benchmarks will show them where to look. In practice, a benchmark compared against misclassified internal spend produces a variance no one can interpret, because the first question it raises is whether the gap is real or a mapping error. External data earns its cost only once you can trust what you are comparing it to.
The distinction matters because internal data answers what you did and external data answers whether it was any good. Procurement teams working only from internal data can optimize against their own history indefinitely without ever discovering they are paying above market.
Raw data from any of these is a liability until it is governed. Data quality, more than tooling, decides whether an analytics program produces actionable insights or a series of meetings about why the numbers disagree.
What procurement analytics is used for
The benefits of procurement analytics are easier to argue from use cases than from principles. These are the procurement analytics use cases that consistently justify the investment.
Spend analysis and category strategy
Classified spend tells you where concentration exists, where fragmentation is costing you leverage, and which categories deserve sourcing attention this year. Sourcing strategies built on spending patterns instead of last year's calendar are the most common first win.
Supplier performance tracking
On-time delivery, quality rejection rates, price variance against contract, responsiveness. Supplier data accumulated across enough transactions becomes a scorecard, and a scorecard changes negotiations by replacing impressions with a record. It also improves supplier relationships, since suppliers generally prefer being measured on something specific to being managed on a hunch.
Supplier risk management
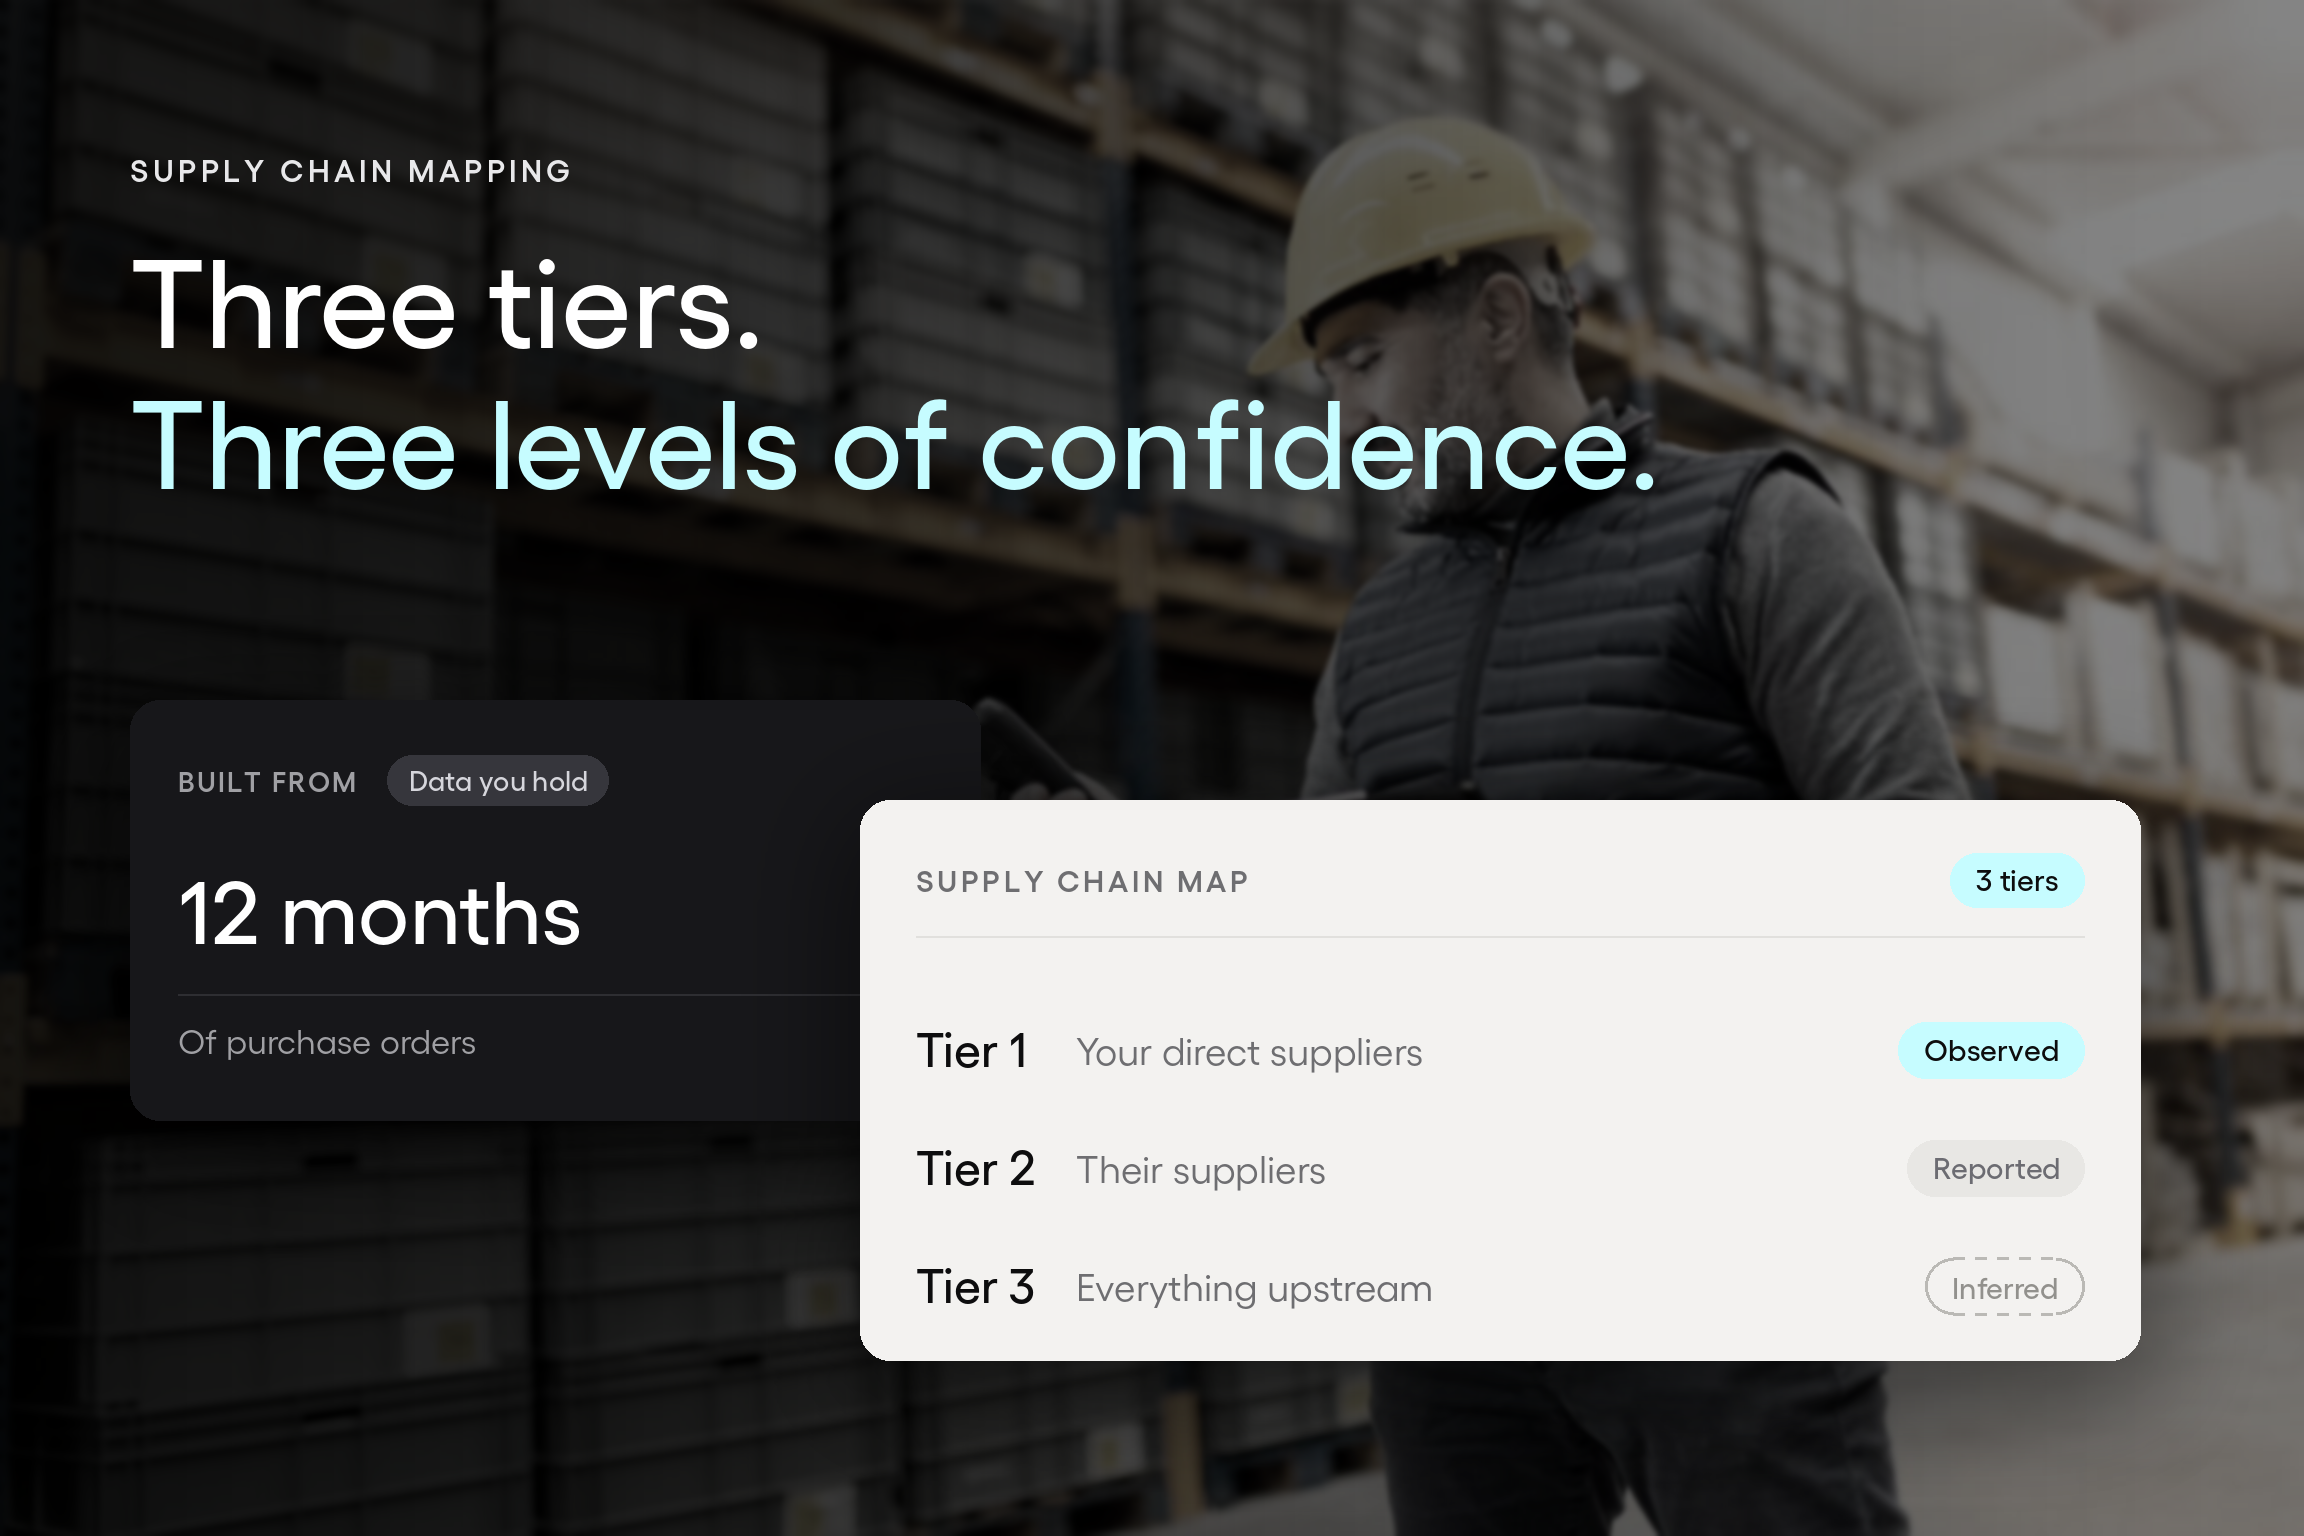
Combining internal dependency data with external supplier financial health data identifies the vendors where a failure would hurt and where distress is already visible. Visibility drops off sharply past the first layer of the supply base: McKinsey's 2025 supply chain risk survey found 95% of respondents had visibility into tier-one suppliers, versus 42% for tier two and beyond.
Contract compliance
The gap between what was negotiated and what was paid is usually invisible without analysis and usually material once you look. Contract management data joined to invoice data is how leakage gets found.
Total cost of ownership
Unit price is the visible cost. Analysis that incorporates freight, rework, quality failures, payment terms, and switching costs makes a total cost of ownership argument stand up when procurement recommends the supplier that is not cheapest.
Demand forecasting
Historical consumption patterns projected forward. This is where procurement analytics connects to inventory and supply chain planning.
Process efficiency
Cycle times, approval bottlenecks, exception rates, and the proportion of spend arriving without a purchase order. The spread here is wide enough to be worth measuring: APQC's benchmarking puts the cost of processing a single purchase order anywhere from $14 to more than $54, depending on the organization. This is analytics turned on procurement processes themselves, and it is the category procurement teams most often forget to measure.
Here is what these look like joined together. Consider a manufacturer that found packaging spend up 14% year over year.
- Descriptive analysis showed the increase.
- Diagnostic analysis showed that only a fraction tracked the resin index, and the rest came from a single plant buying outside the negotiated agreement because the contracted supplier's lead time had slipped.
- Contract compliance data confirmed the leakage.
- Supplier performance data explained the behavior, and the resulting decision was not a renegotiation but a second approved source and a change to the plant's ordering threshold.
No individual dataset would have produced that answer. The value came from combining procurement and supplier data.
The seven metrics that make analytics legible to a board
Procurement analytics earns executive attention when it produces numbers that connect to enterprise outcomes rather than to procurement activity. These seven procurement KPIs and metrics do that reliably.
1. Spend under management
Spend under management is the proportion of total organizational spend that runs through a governed process. This is the single most useful number procurement can report to a board, because it describes the size of the surface procurement can influence. Everything else is conditional on it.
It is also the metric most often inflated. Spend under management counts spend procurement governs, meaning sourced, contracted, and transacted through the process. It does not count spend the procurement team only sees after the fact. The accurate version of this number is usually lower than the first version anyone calculates, and the gap between them is the most useful thing it reveals.
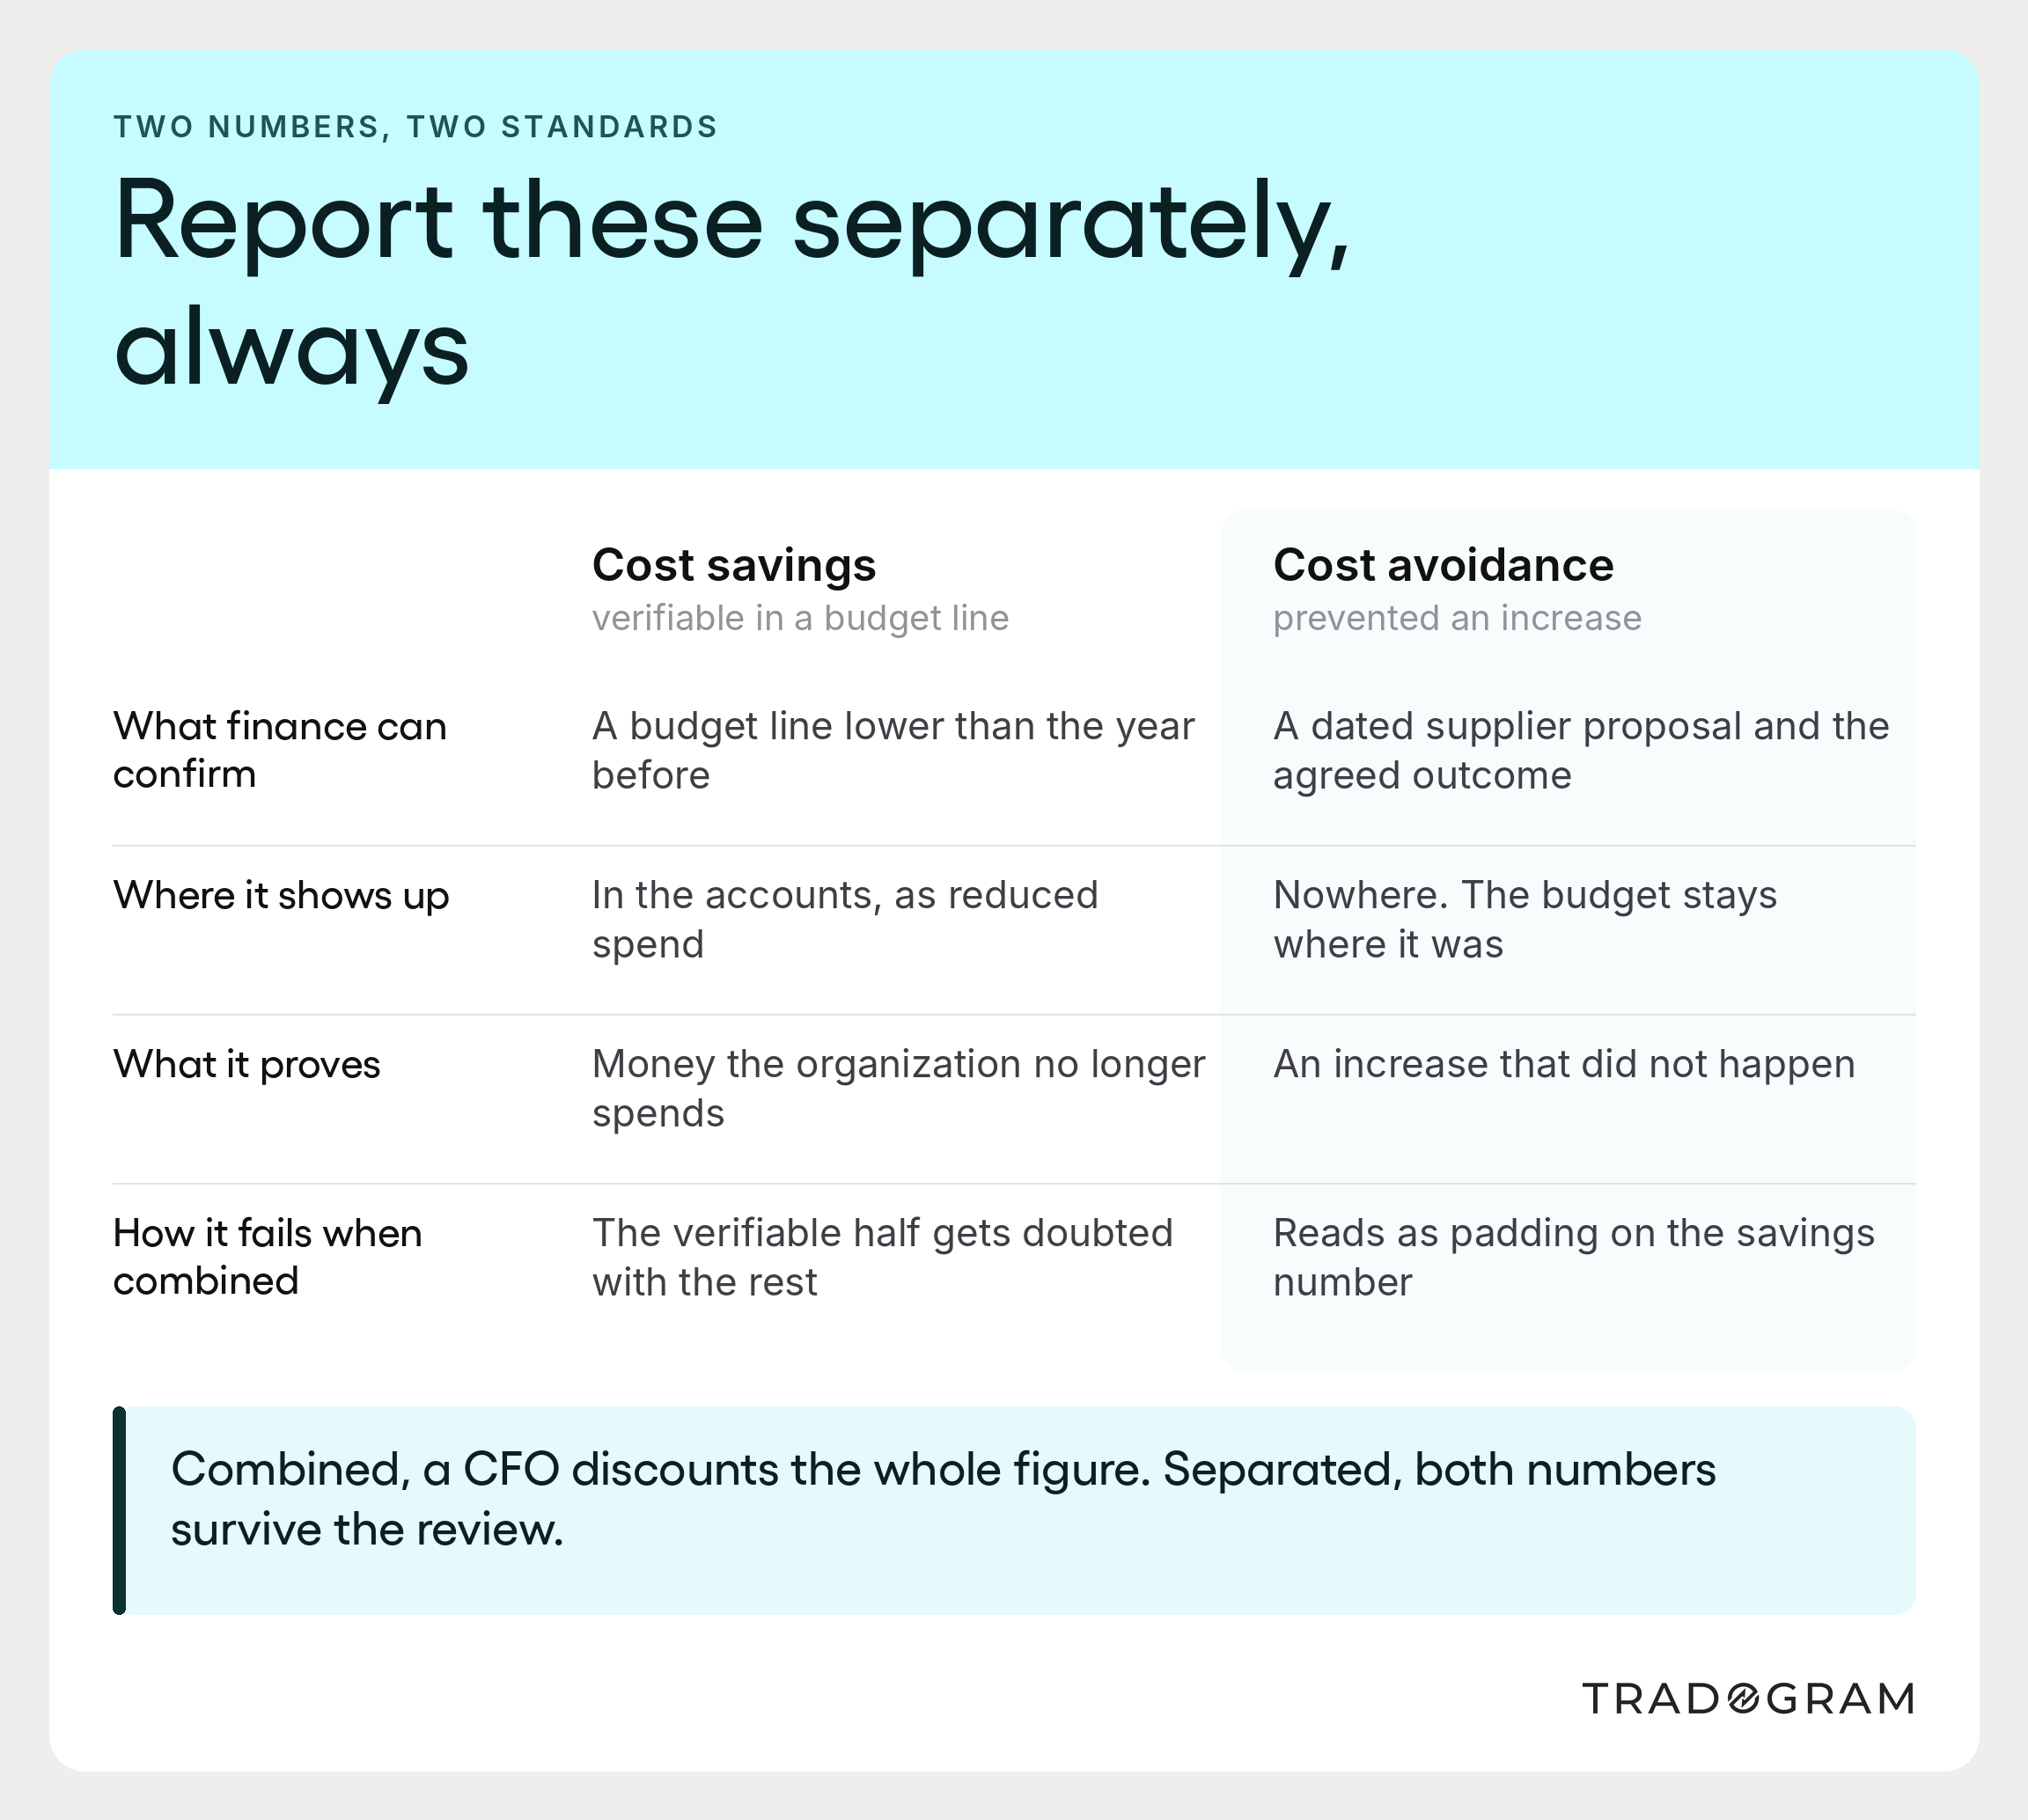
2 and 3. Cost savings and cost avoidance (reported separately)
Savings reduce a budget line that finance can verify. Cost avoidance prevents an increase that would otherwise have happened. Both are real. Reporting them together is the fastest way to lose credibility with a CFO, because it invites the suspicion that the second is padding the first.
4. Contract compliance rate
The proportion of spend transacted against negotiated terms. A low rate explains why realized savings fall short of negotiated savings, a question procurement gets asked constantly and can rarely answer without this metric.
5. Supplier performance against agreed standards
Aggregated, this tells an executive whether the supply base is getting more or less reliable, which is a supply chain question dressed as a procurement one.
6. Procurement ROI
Value delivered against the cost of running the function. Blunt, and the number an executive will reach for to decide whether procurement offers value.
7. Cycle time
Cycle time from requisition to order is the clearest measure of whether procurement operations are a service or an obstacle, and the one most visible to the rest of the business. APQC's open-standards benchmarking puts the median at 2.0 days from requisition to purchase order for goods across 1,181 organizations, giving the board a number to benchmark against.
The framing matters as much as the selection. Key performance indicators presented as procurement's report card invite scrutiny. The same metrics presented as a description of how the organization's money behaves invite a conversation about what to do next. Procurement and finance teams that agree on these definitions in advance spend far less time arguing about whether a number is real.
How to implement procurement analytics without a two-year program
The failure mode in most analytics programs is scope. An organization decides to build a complete data model covering every category and every system, and eighteen months later has a well-designed architecture and no answered questions.
The sequence that works runs the other way around. Pick a question, get the data good enough to answer it, answer it, then widen.
Start with one category and one question
Something specific enough to act on. "Are we paying above market for packaging" is a better starting point than "improve spend visibility," because it has an owner, a deadline, and a decision attached.
Fix classification for that scope only
Deduplicate the suppliers, normalize the item descriptions, and reconcile the records for the categories in question. This is the work, and doing it for one category teaches you what doing it for all of them will cost.
Automate the refresh before you extend the scope
A question answered once is a project. A question answered continuously is a capability. Wire the data collection before adding the next category, or you will rebuild the same extract repeatedly.
Connect the systems instead of exporting from them
Keeping purchase orders, receipts, and invoices held in one place removes most of the reconciliation work before it starts. Procurement analytics software that reads from a single governed record is doing a fundamentally easier job than one stitching three exports together.
Add external data once internal data is trustworthy
Market indices and supplier financial health feeds are high-value and low-value in that order: high value on clean internal data, low value on dirty internal data, because you cannot tell whether a variance is a real signal or a classification error.
Give it to a person, not a committee
A procurement data analyst, or someone holding that responsibility alongside another role. Analytics capabilities degrade without an owner faster than almost any other procurement investment.
In our experience, organizations that follow this sequence can reach useful diagnostic analysis inside a quarter. Organizations that start with platform selection tend to reach it much later, if at all, because the tool arrives before anyone agrees on what question it answers.
What AI changes in procurement analytics, and what it does not
The most consequential thing AI does for procurement analytics is not forecasting. It is classification.
Spend classification has always been the bottleneck. Mapping millions of transaction lines to a consistent taxonomy is slow, tedious, and the first thing to be deprioritized when procurement analysts have other work.
Machine classification runs continuously, whereas a person could only run it quarterly, and that removes the specific constraint that has kept most organizations pinned to the first rung of the maturity ladder. It is a larger change to procurement performance than any predictive model, because it unlocks everything above it.
Access is no longer the obstacle either. The Hackett Group's 2026 Key Issues research found 43% of organizations pursuing AI, 12% at large scale, and 69% now reaching AI capability embedded in platforms they already own.
Three other capabilities are new, not faster versions of old ones:
Continuous supplier monitoring
Watching financial distress signals across a supply base in real time. Supplier management moves from periodic assessment to standing awareness, which is the difference between reacting to a supplier failure and anticipating it.
Scenario modeling at speed
What-if analysis across categories, suppliers, and volumes that previously took an analyst a week can be run repeatedly while a sourcing strategy is still being formed. Procurement strategies get tested rather than defended.
Anomaly detection
Surfacing purchasing behavior that departs from established spending patterns without anyone having specified what to look for in advance. This catches the things a report designed around known questions structurally cannot.
What AI does not change is the input. Data analytics of any sophistication inherits the quality of what it is given, and a model trained on inconsistent supplier records will classify confidently and wrongly. It also does not change accountability. A recommendation still needs someone to own the decision, and organizations that treat model output as a decision rather than an input tend to discover the difference during an audit.
The practical position: use machine classification early, because it attacks the real constraint and improves operational efficiency in the function immediately. Treat predictive and prescriptive output as a proposal that a person evaluates. The key procurement analytics work remains judgment applied to evidence, and the evidence has simply become cheaper to produce.
Where the investment case sits
The argument for analytics in procurement is usually made on savings, but that is the weakest version of the argument.
The stronger version is arithmetic about capacity. The Hackett Group's 2026 Key Issues research projects procurement workloads rising 8% in 2026 while both headcount and operating budgets decline. That describes a function being asked to absorb more work with fewer resources, in the same year. Headcount is not the answer, because the budget for it does not exist.
Analytics is one of a small number of levers that change what a given number of procurement professionals can cover.
The size of that lever is documented. The Hackett Group's Digital World Class research found top-performing procurement organizations running requisition-to-purchase-order cycles 58% shorter, operating with 31% fewer full-time staff at 19% lower cost, and losing 60% less of their negotiated savings to off-contract buying and contract noncompliance. Those are process outcomes, and every one of them depends on knowing what is happening in the data.
The second part of the case is about where capability concentrates. Deloitte's 2025 Global CPO Survey, covering more than 250 CPOs, identified a group it calls Digital Masters managing roughly $20 million of spend per employee, about six times the rate of the group it calls Followers.
Read that gap carefully.
The causation runs in both directions. Organizations that already have governed data get more from every tool they buy, which means the returns partly reflect the data foundation rather than the technology.
An organization that buys the same procurement analytics solutions on top of unclassified spend should not expect the same multiple. The foundation determines the return, and the foundation is cheaper than the technology.
The third part is competitive, and it is the part executives tend to grasp fastest. Procurement analytics capability is a competitive advantage in the narrow, defensible sense: two companies buying the same inputs in the same market will not pay the same, and the difference is visibility.
Deloitte's Digital Masters influence 80% of enterprise spend against 65% for their peers. Influence requires knowing where the money goes. This is where procurement data sources and their governance stop being a technical concern and become strategic.
What to ask for in the next budget cycle
If you are making the case internally, the request that gets approved is rarely the one for a platform. It is the one for a specific, bounded capability with a named outcome, and it usually costs less than people expect.
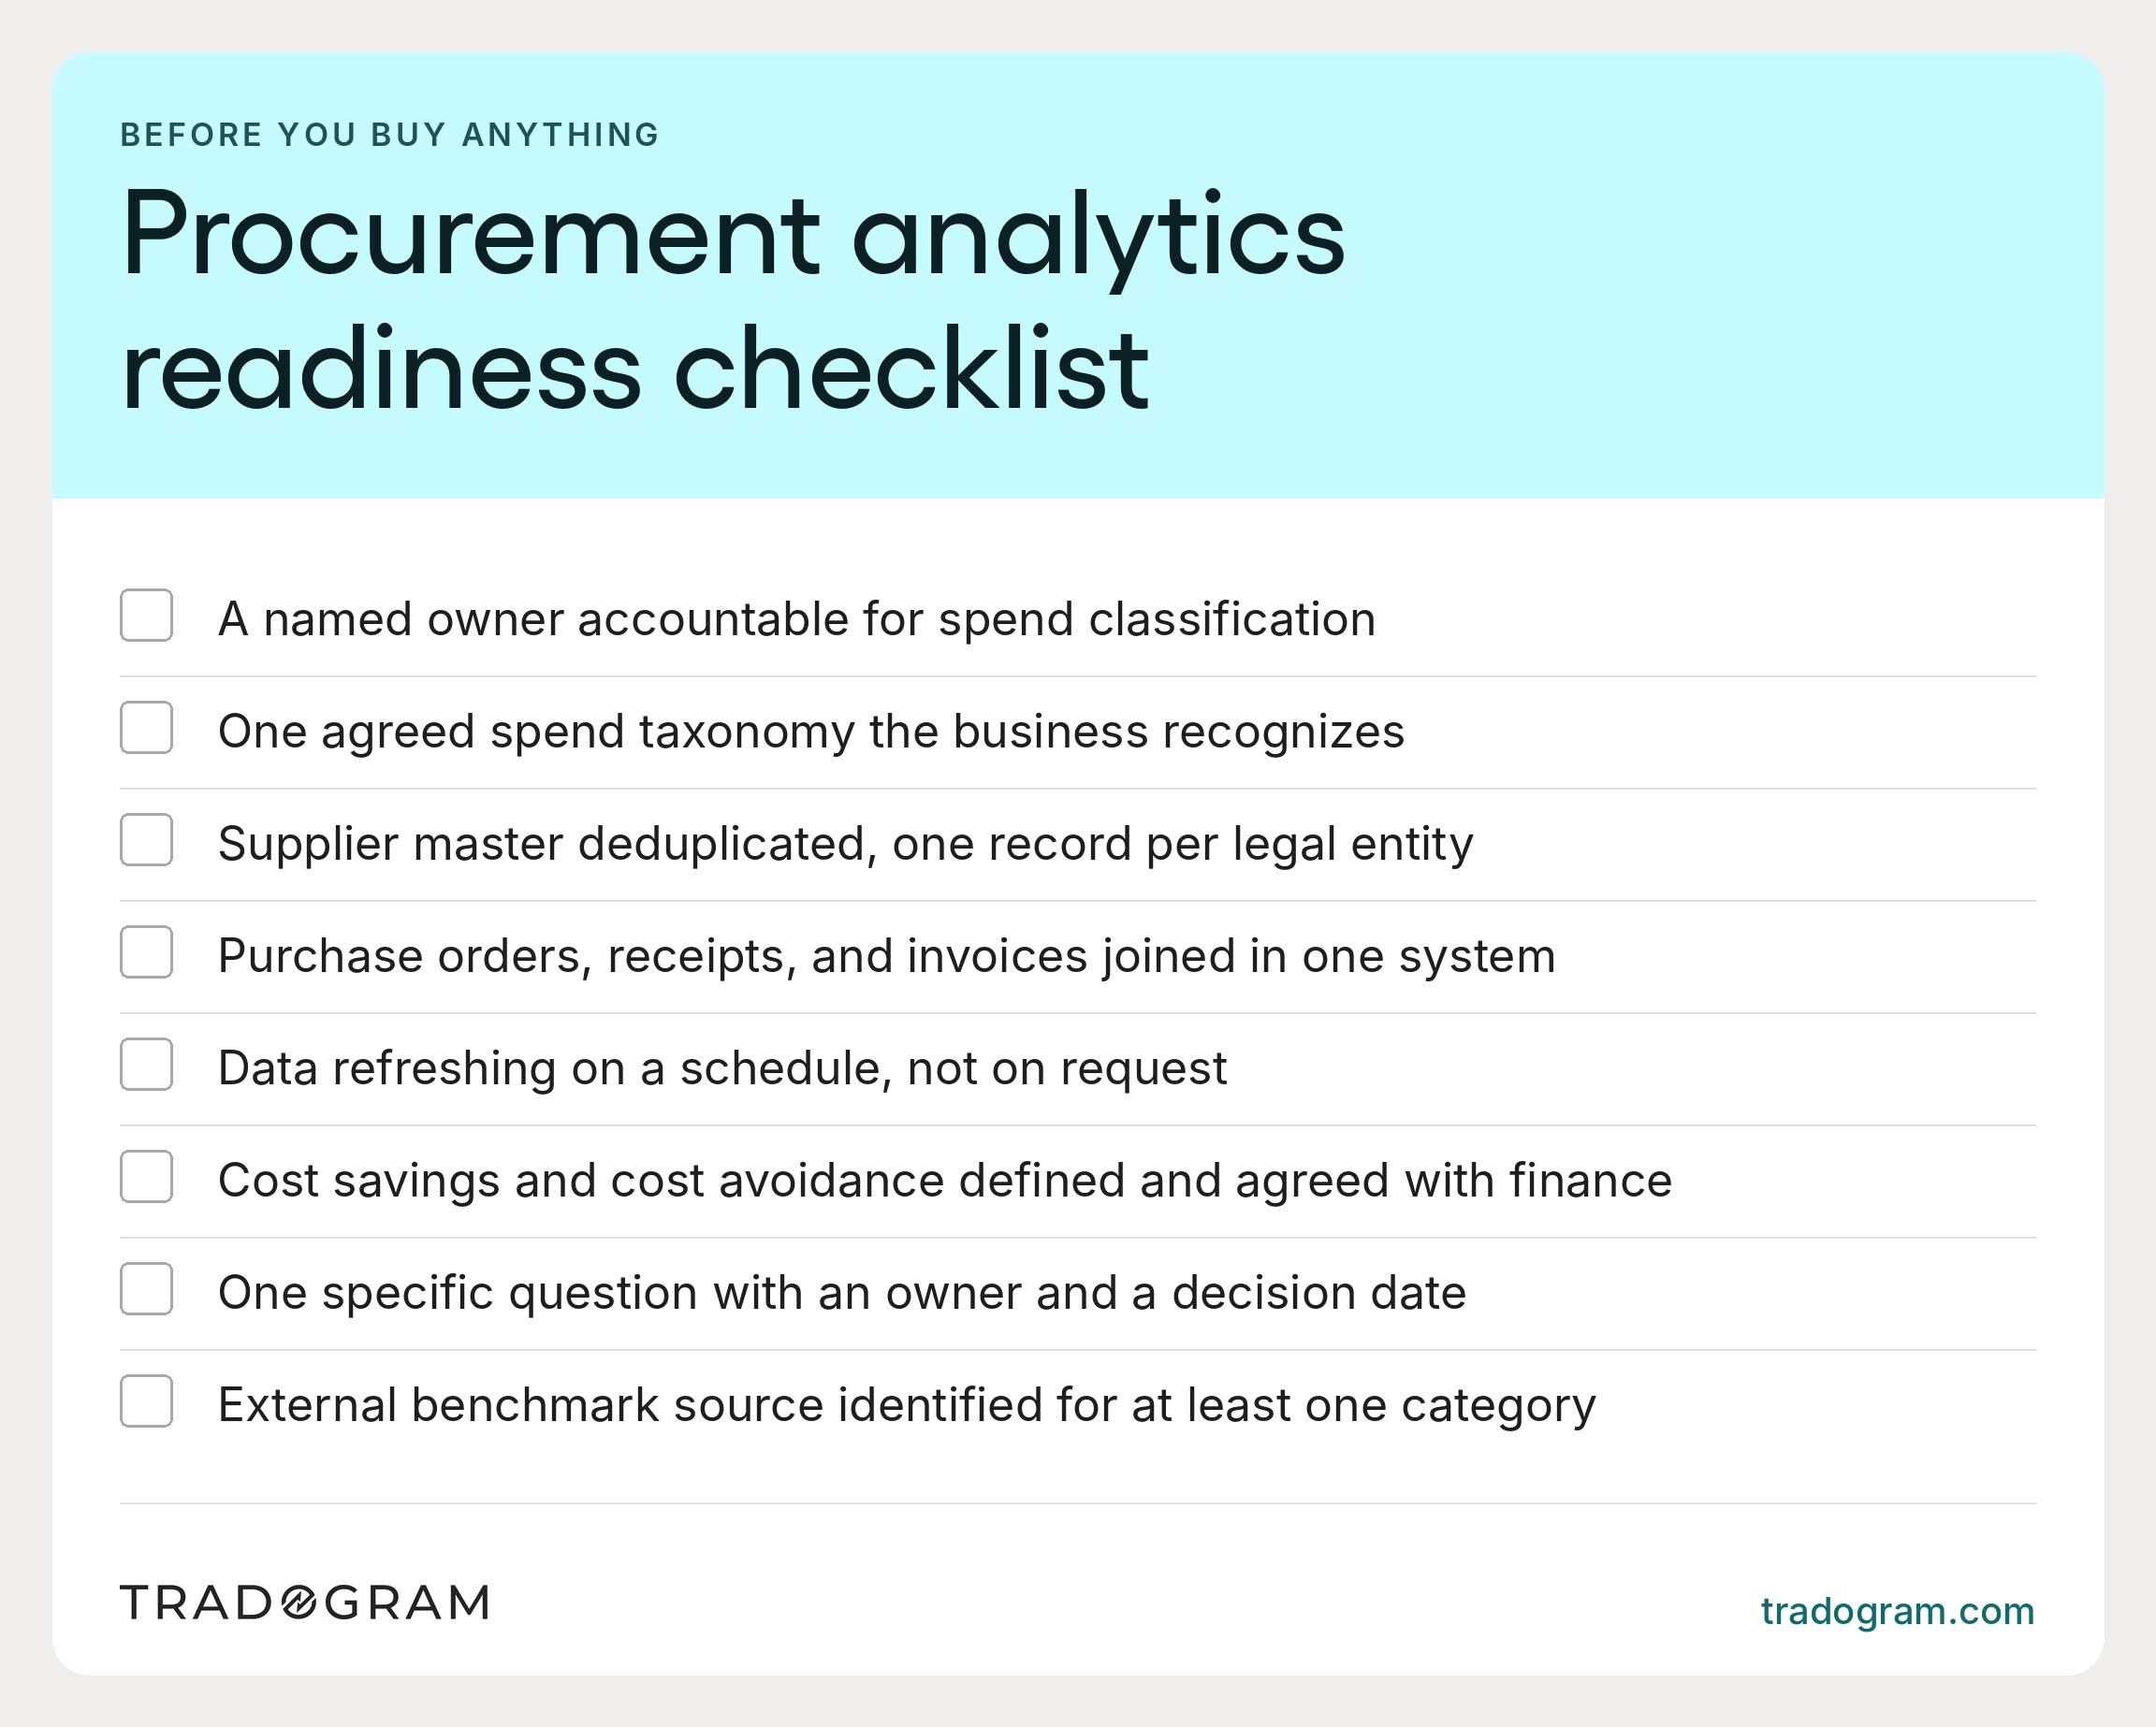
Ask for data ownership before tooling. A named owner for spend classification, even at half a role, is the highest-return line item in an analytics budget and the easiest to justify because it is small. Procurement analytics systems bought without it tend to be renewed reluctantly.
Ask for one integration, not an architecture. Connecting purchase orders, receipts, and invoices into one record removes more reconciliation work than any analytical tool adds. Where procurement systems and finance systems already talk, most of the hard part is done.
Ask for a question with a date. Bring the specific decision the analysis will inform and when it has to be made. Budget conversations go differently when the request is attached to a sourcing event in Q3 with a decision date on it.
Ask for the benchmark, not just the internal number. External data converts an internal report into a judgment about whether performance is good. It is also modest in cost relative to what it changes about the conversation.
Be clear about your maturity level. Claiming predictive capability on descriptive data is the fastest way to lose the budget the following year. A CFO will fund a credible plan to answer harder questions far more readily than an implausible claim to be answering them already.
The organizations that retire the quarterly spreadsheet rarely do it by buying a bigger tool. They do it by making one number checkable, agreeing its definition with finance before reporting it, and wiring the data so the next person doesn't have to rebuild the mapping by hand. Procurement metrics become persuasive at exactly the point they become checkable, and everything in a procurement analytics program is in service of that.
Where Tradogram fits
Most of what this guide recommends starts in the same place: a purchasing record that is complete, current, and connected before anyone runs an analysis on it. That is the part Tradogram handles.
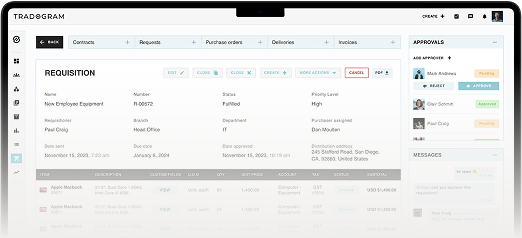
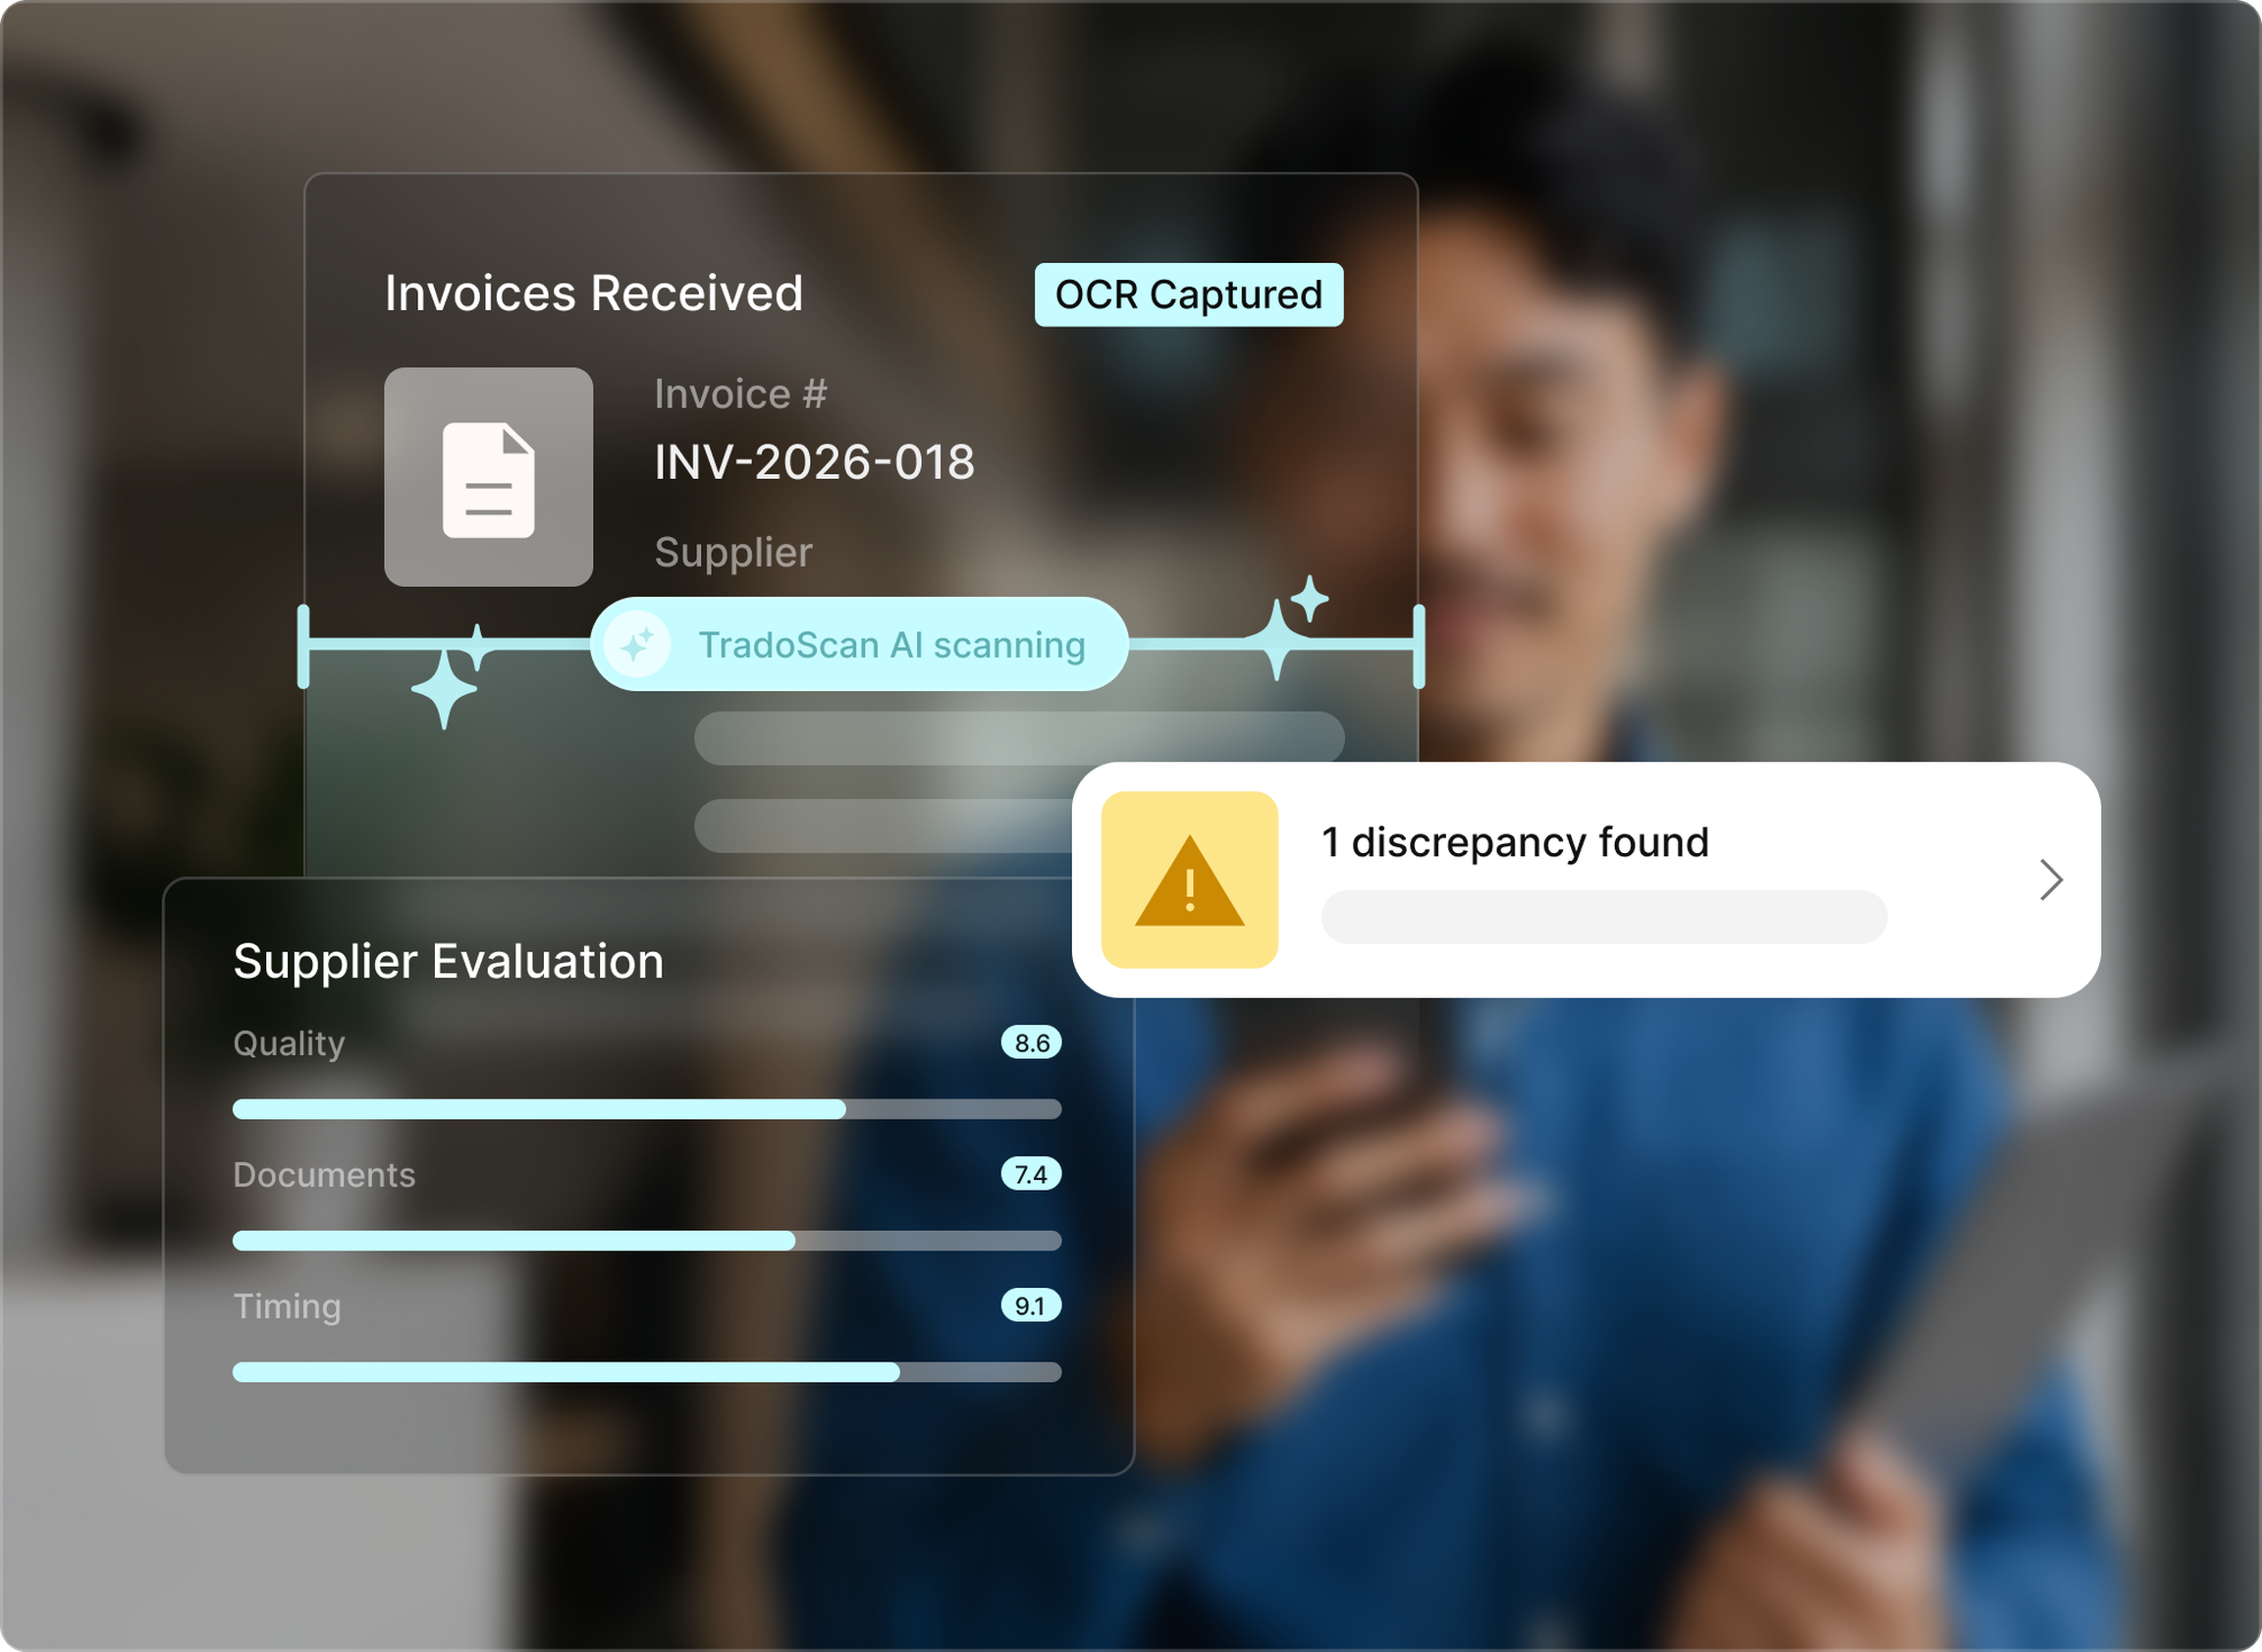
Requests, approvals, purchase orders, receipts, and invoices sit in one system, so the record behind a spend figure exists the moment the purchase does. Budgets are checked when a request is raised, and approvals follow the thresholds you set. When an invoice arrives, TradoScan extracts the data and flags mismatches against the purchase order and receiving record before payment. The records then connect to the accounting or ERP system your finance team already uses.
The result is what the quarterly spreadsheet never delivered: spend figures, compliance rates, and cycle times that finance can trace to a transaction without asking procurement to rebuild them.