

A procurement team reports that it saved $1.4 million last year. The CFO asks where the money went, and nobody can answer, because the savings were calculated against quoted prices rather than what the company actually paid the year before.
The number was real. The baseline was the problem, and nobody agreed on it until the moment it had to be defended. That's the failure mode this guide is about: metrics chosen for how they present rather than for what they can survive.
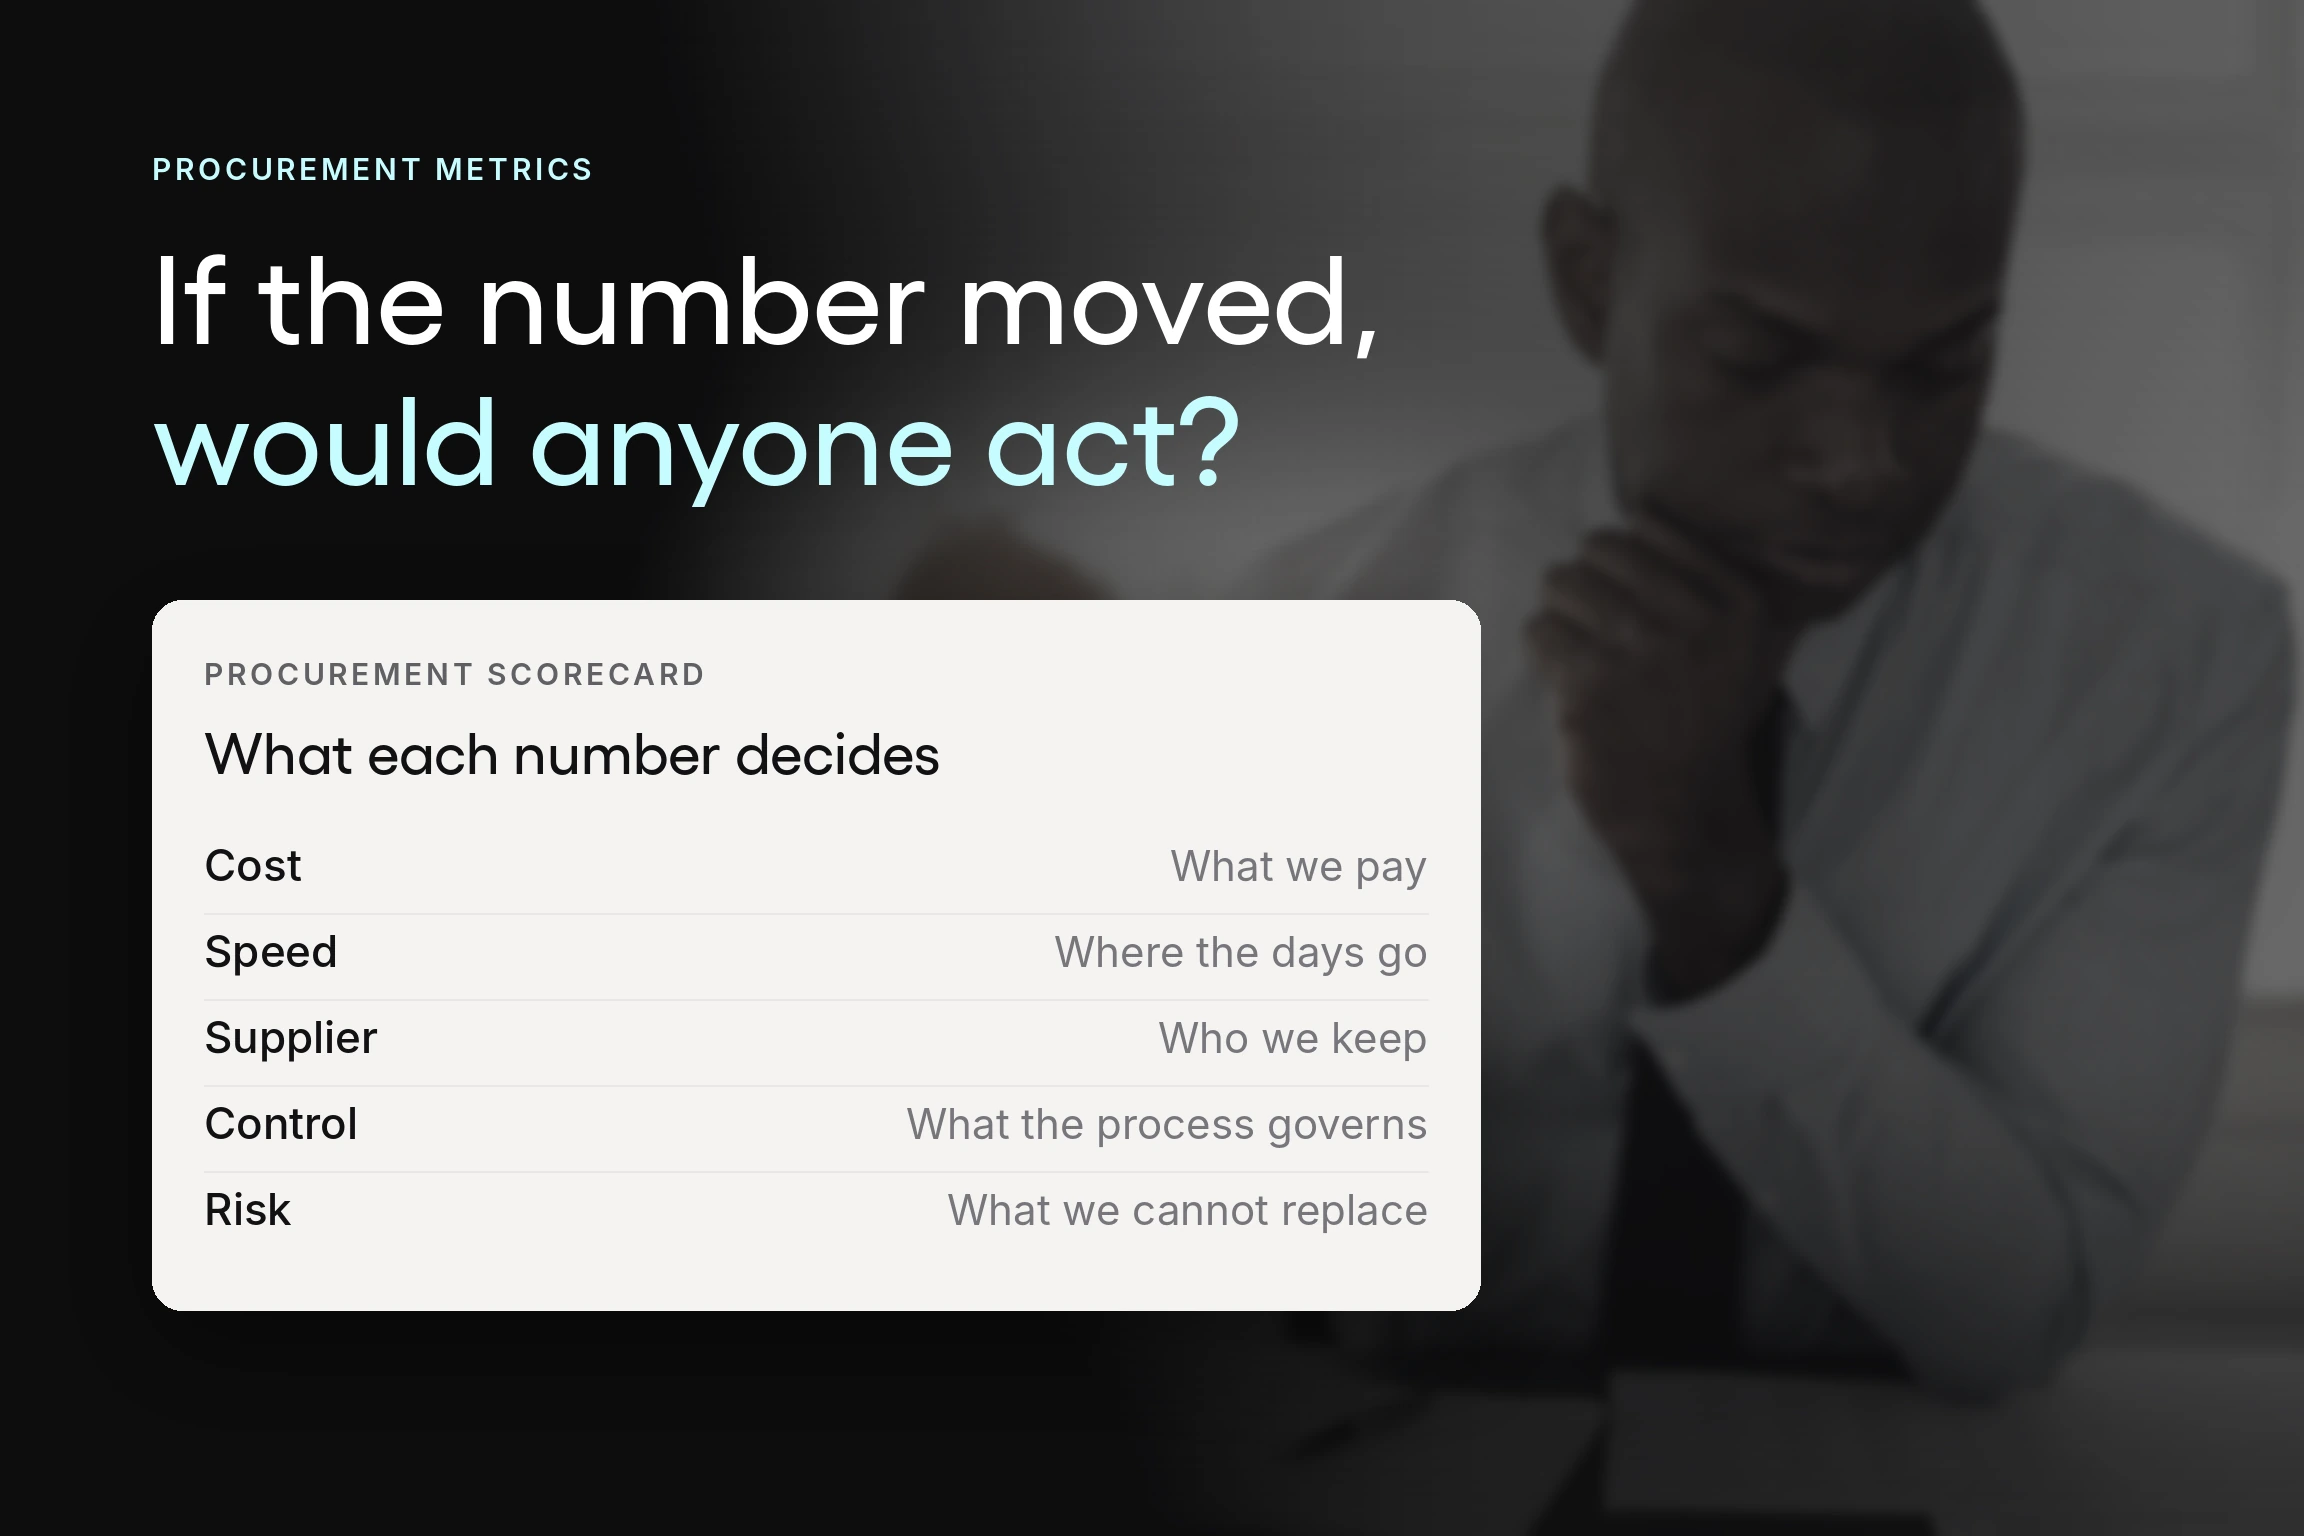
The useful test for any metric is simple: if this number moved, what would we do differently? A metric that survives that question earns its place on the dashboard. One that does not is a report, and reports are how procurement teams end up spending Fridays assembling figures nobody acts on.
At Tradogram, we have helped thousands of organizations digitize their procurement processes, and the teams with the most credible reporting usually track fewer things than the teams with the least.
Procurement metrics and procurement KPIs are related but not interchangeable. Every KPI is a metric, but most metrics never become KPIs. A metric is anything you can count: invoices processed, requisitions submitted, suppliers onboarded.
A KPI is the small set of metrics you've decided a goal depends on, with a target attached and someone accountable for hitting it. The practical test is what happens when the number moves in the wrong direction. If it triggers a conversation and a decision, it's a KPI. If it just sits in a report, it's a metric you're tracking.
This guide covers the metrics worth tracking, how efficiency and effectiveness measures differ, why direct and indirect procurement need separate scorecards, and how to build a set that finance will believe.
Key Takeaways
- A metric is only worth tracking if someone would act differently when it moves. Most procurement dashboards contain numbers nobody has ever used to make a decision. Cutting those is the fastest way to make the rest credible.
- Savings claimed without a documented baseline will not survive the finance review. Cost avoidance and cost reduction are different measures with different defensibility, and mixing them is the most common reason procurement numbers get challenged.
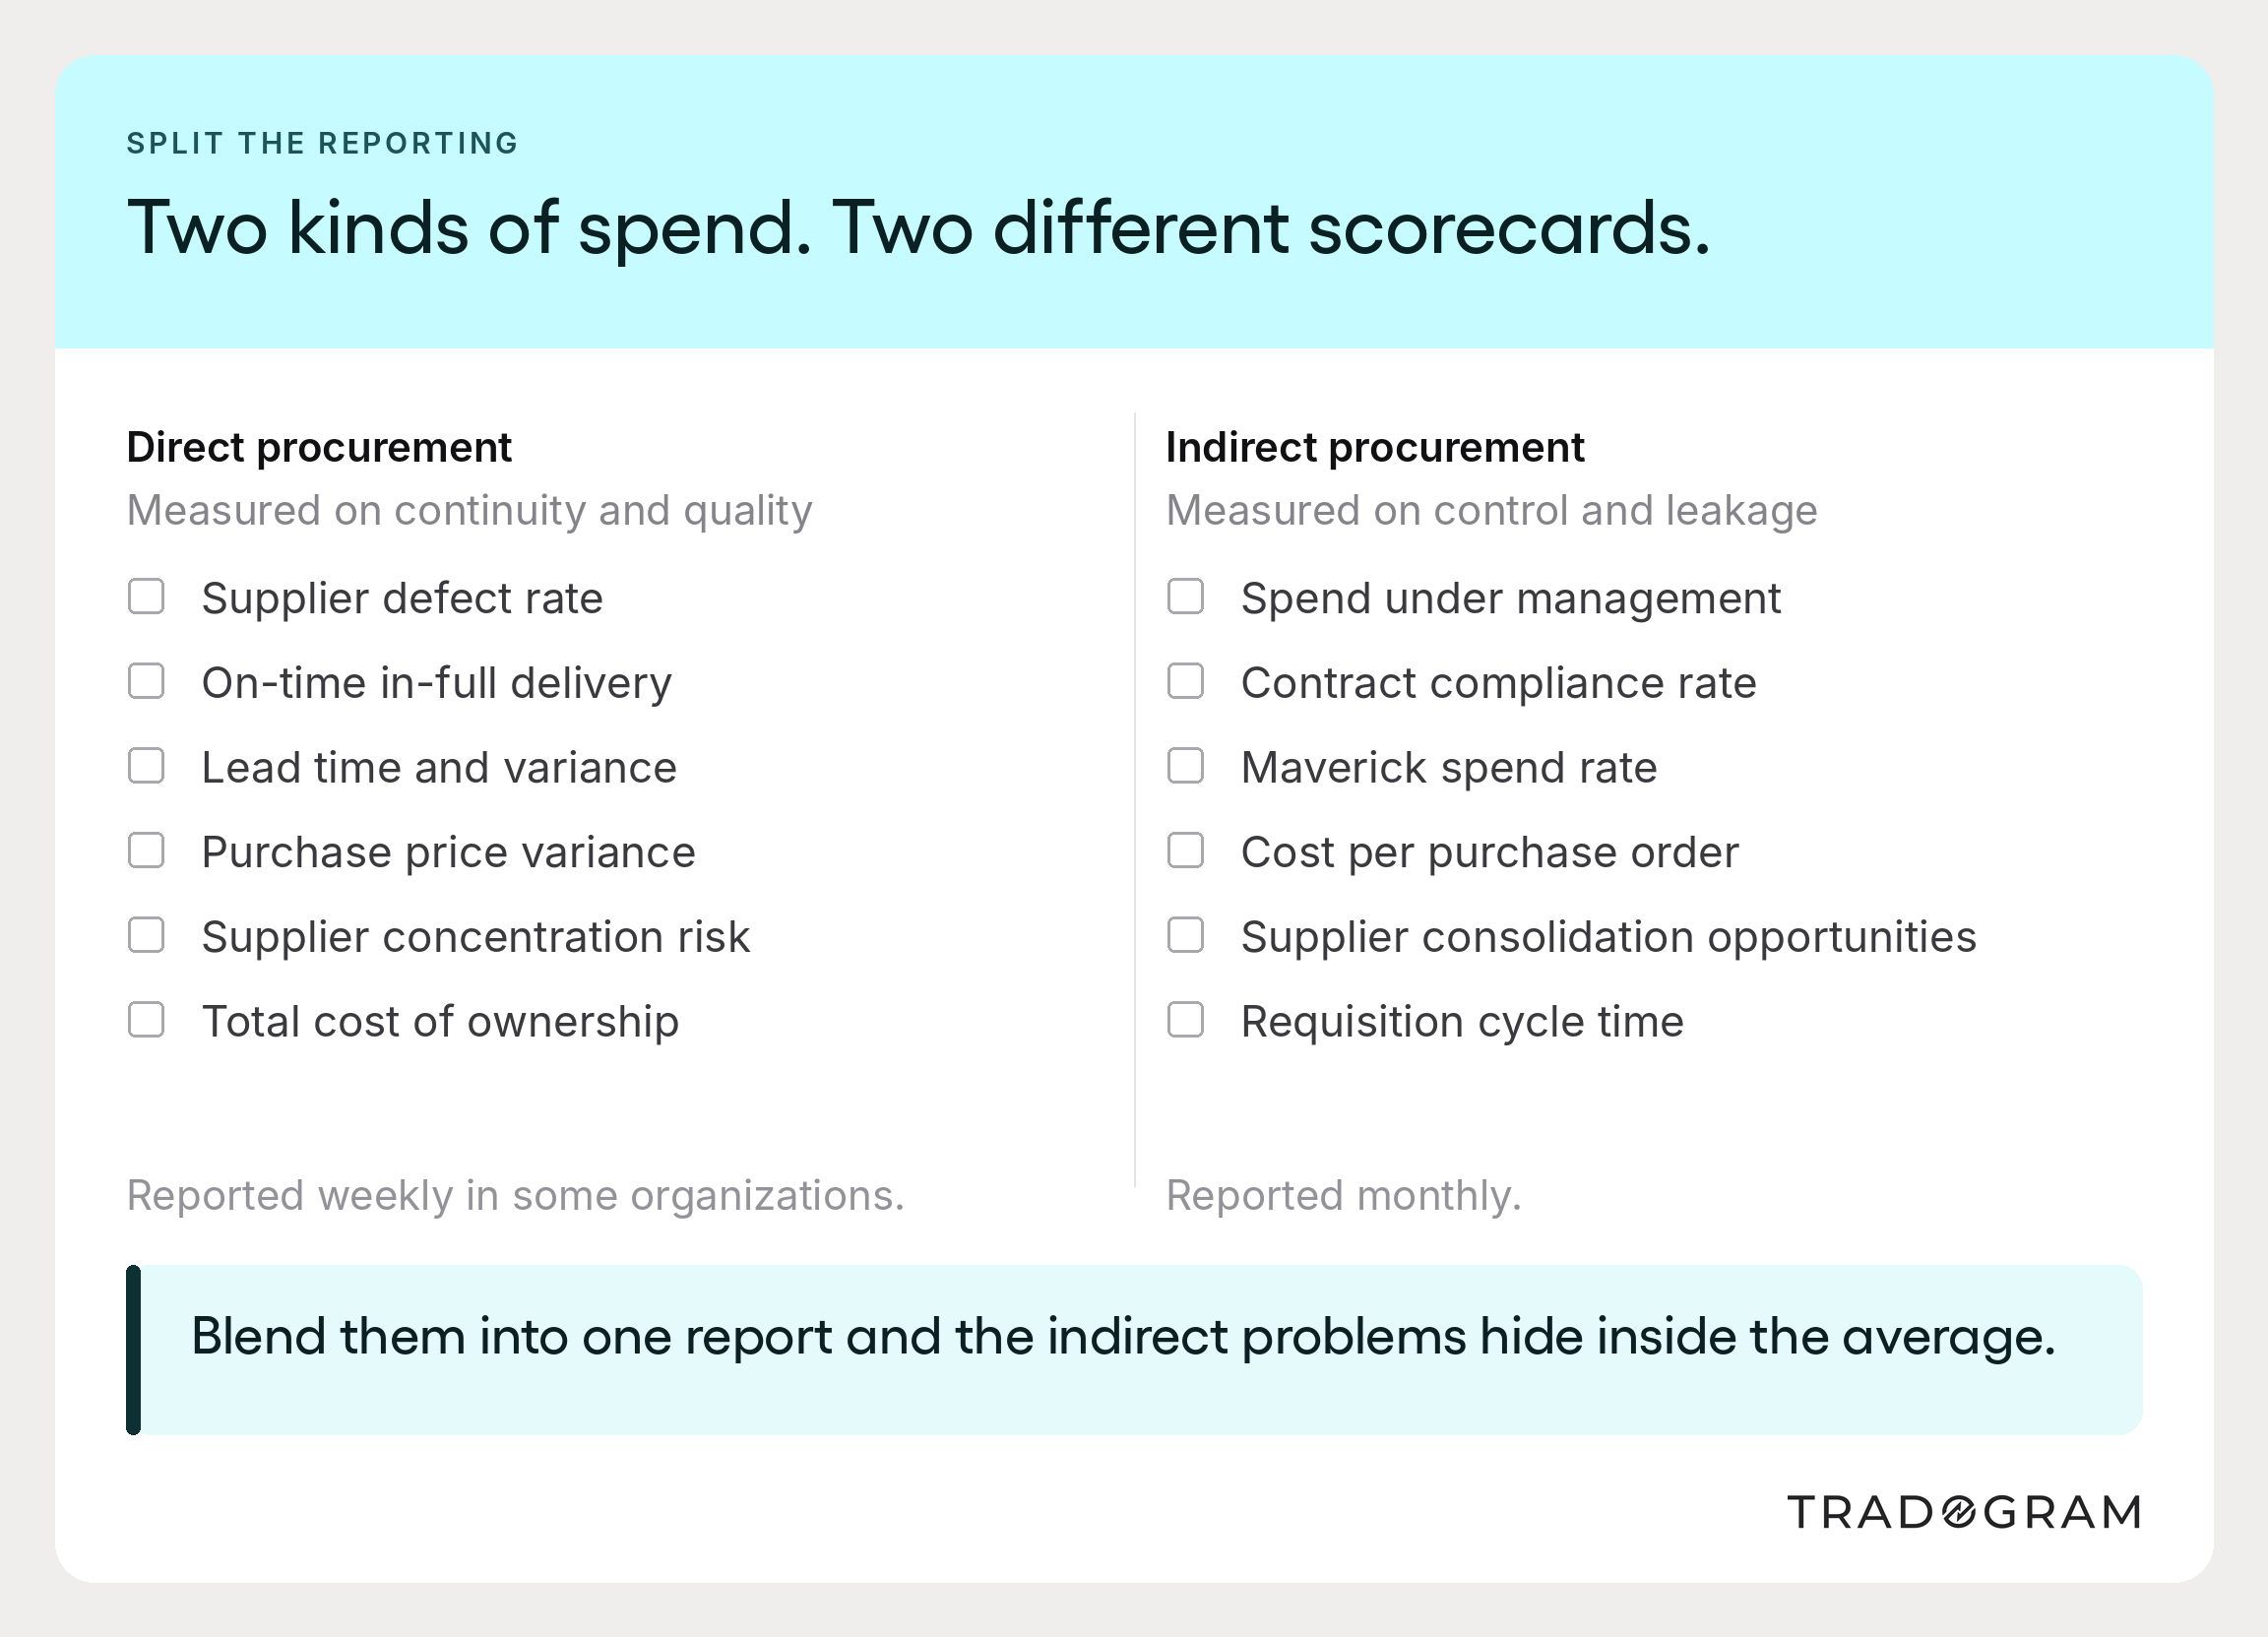
- Direct and indirect procurement need different scorecards. Direct spend is measured on continuity, quality, and unit economics because it goes into the product. Indirect spend is measured on control and compliance because the risk is leakage, not line-down. One dashboard covering both will serve neither well.
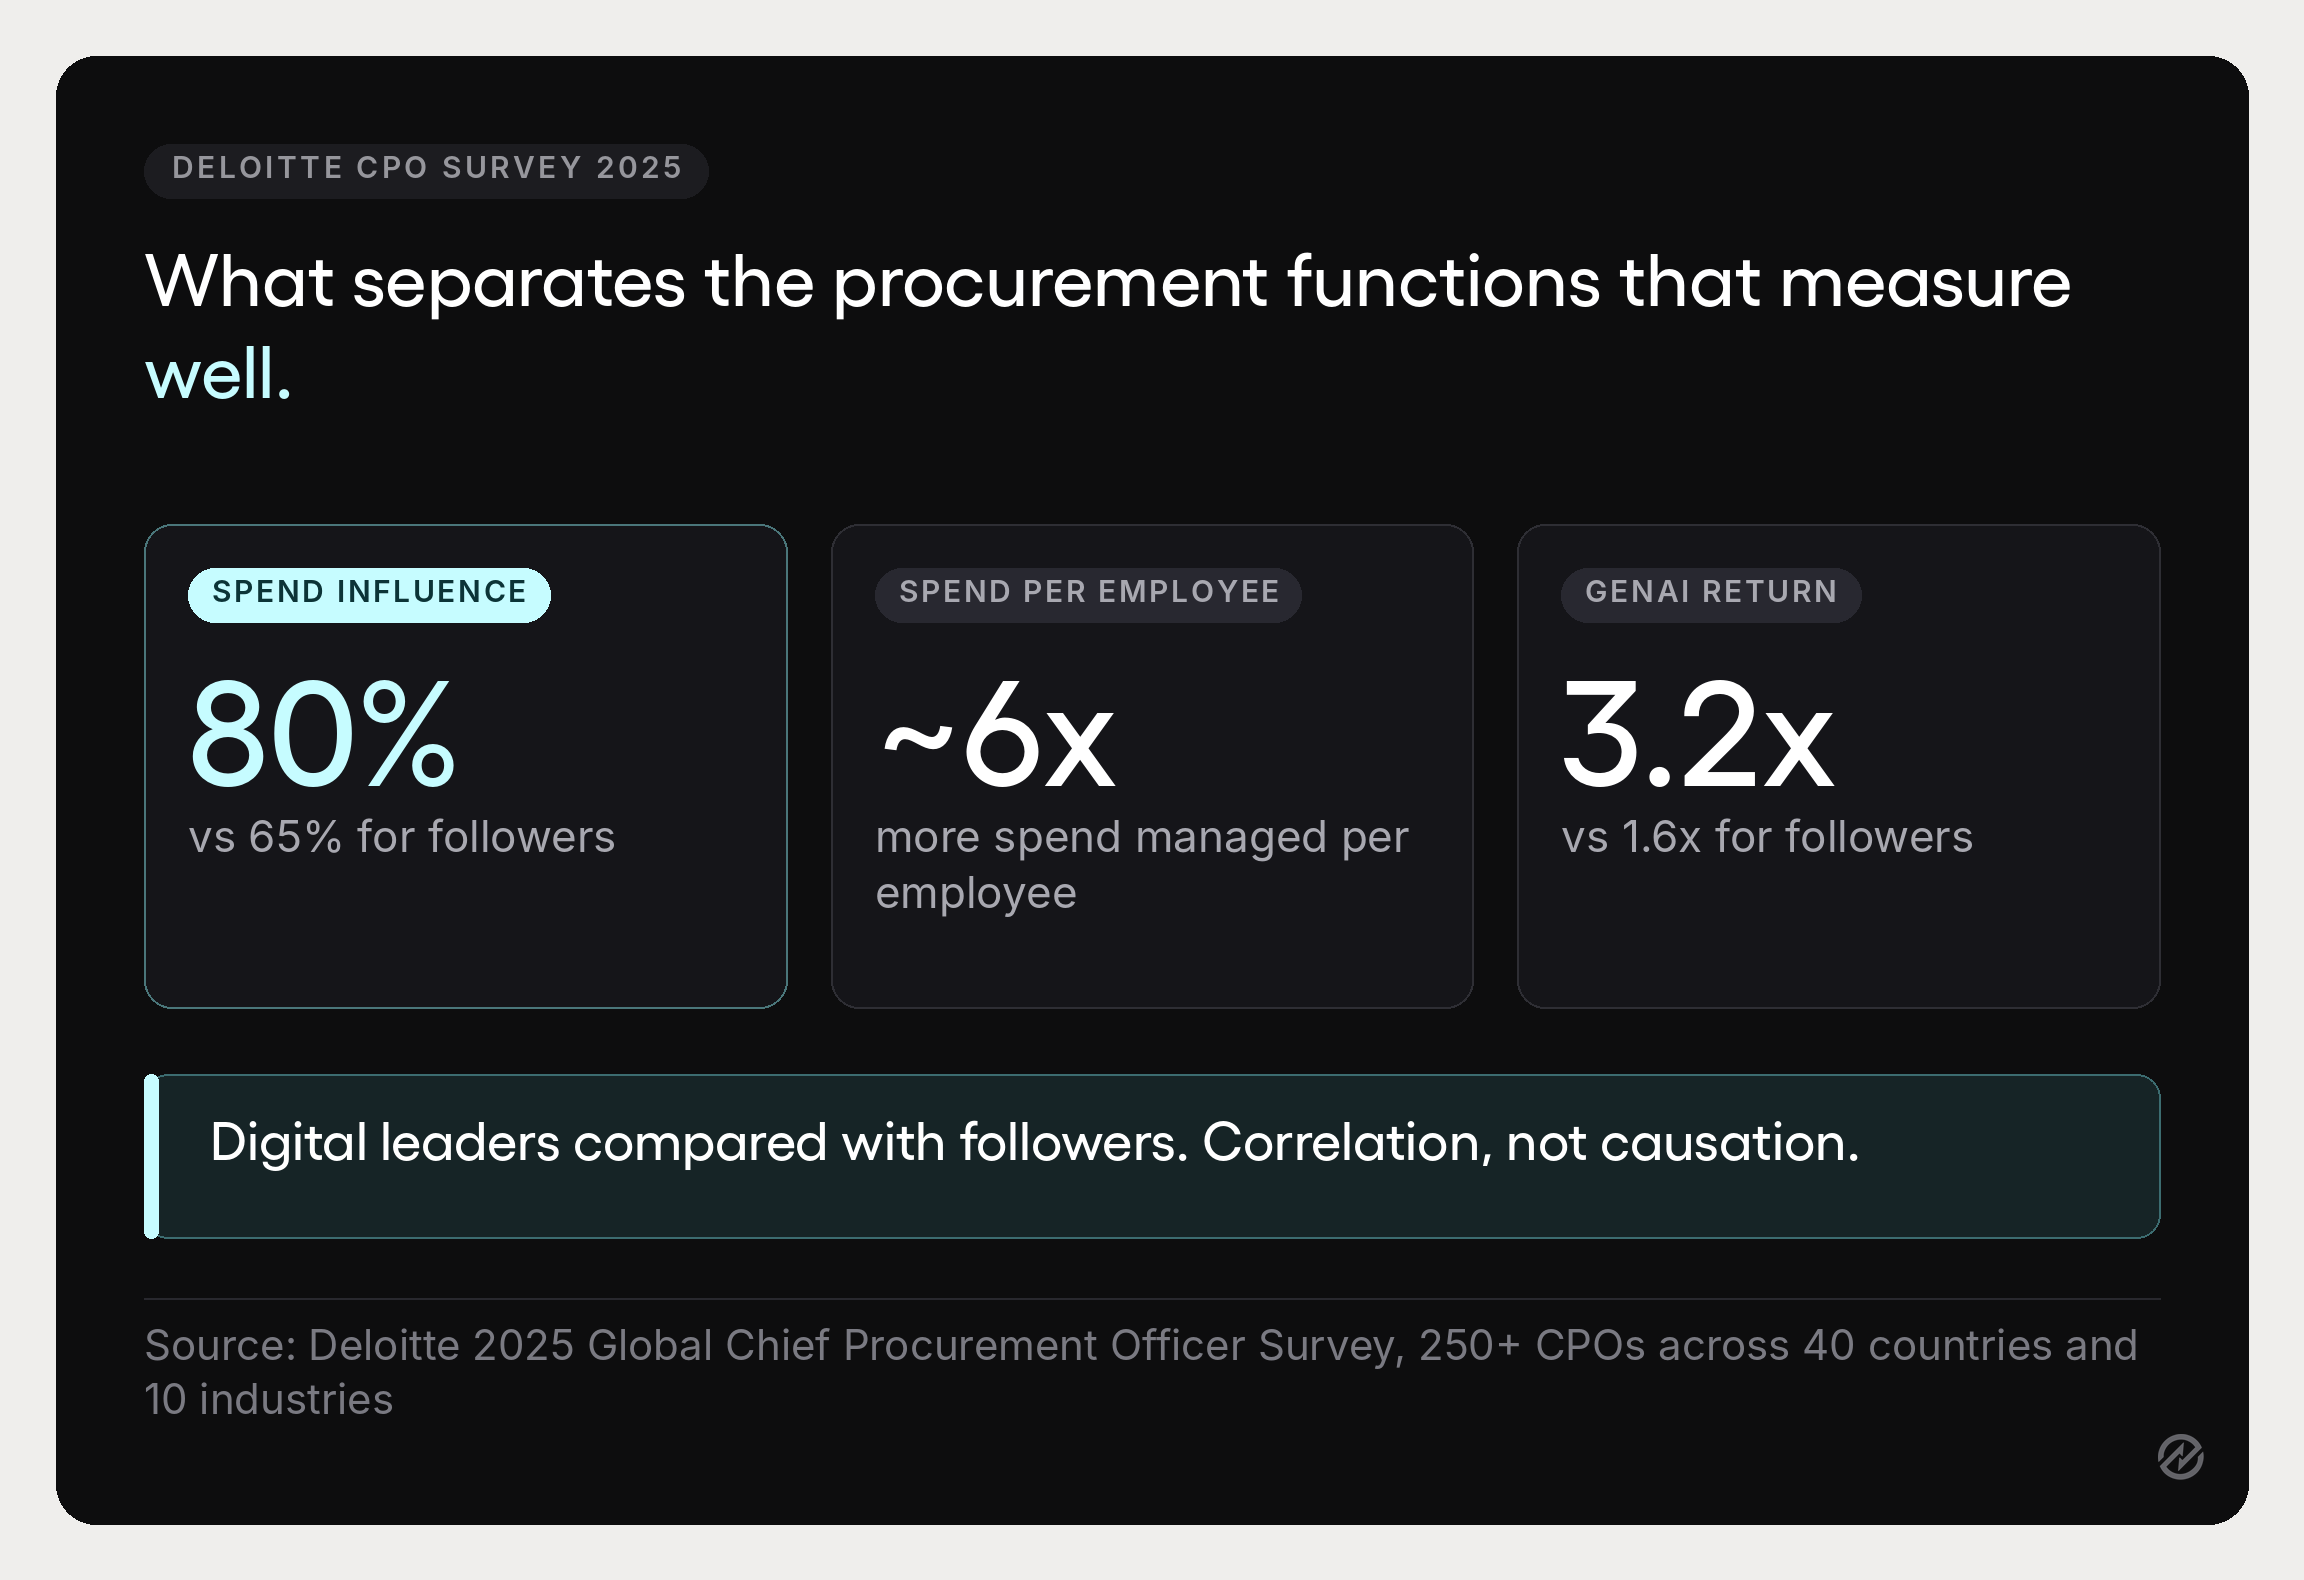
- Spend under management is the single most diagnostic number in procurement. It tells you what share of company spend the process actually governs. Deloitte’s 2025 Global Chief Procurement Officer Survey, covering more than 250 CPOs across 40 countries, found that organizations it classifies as digital leaders report 80% spend influence, compared with 65% for followers.
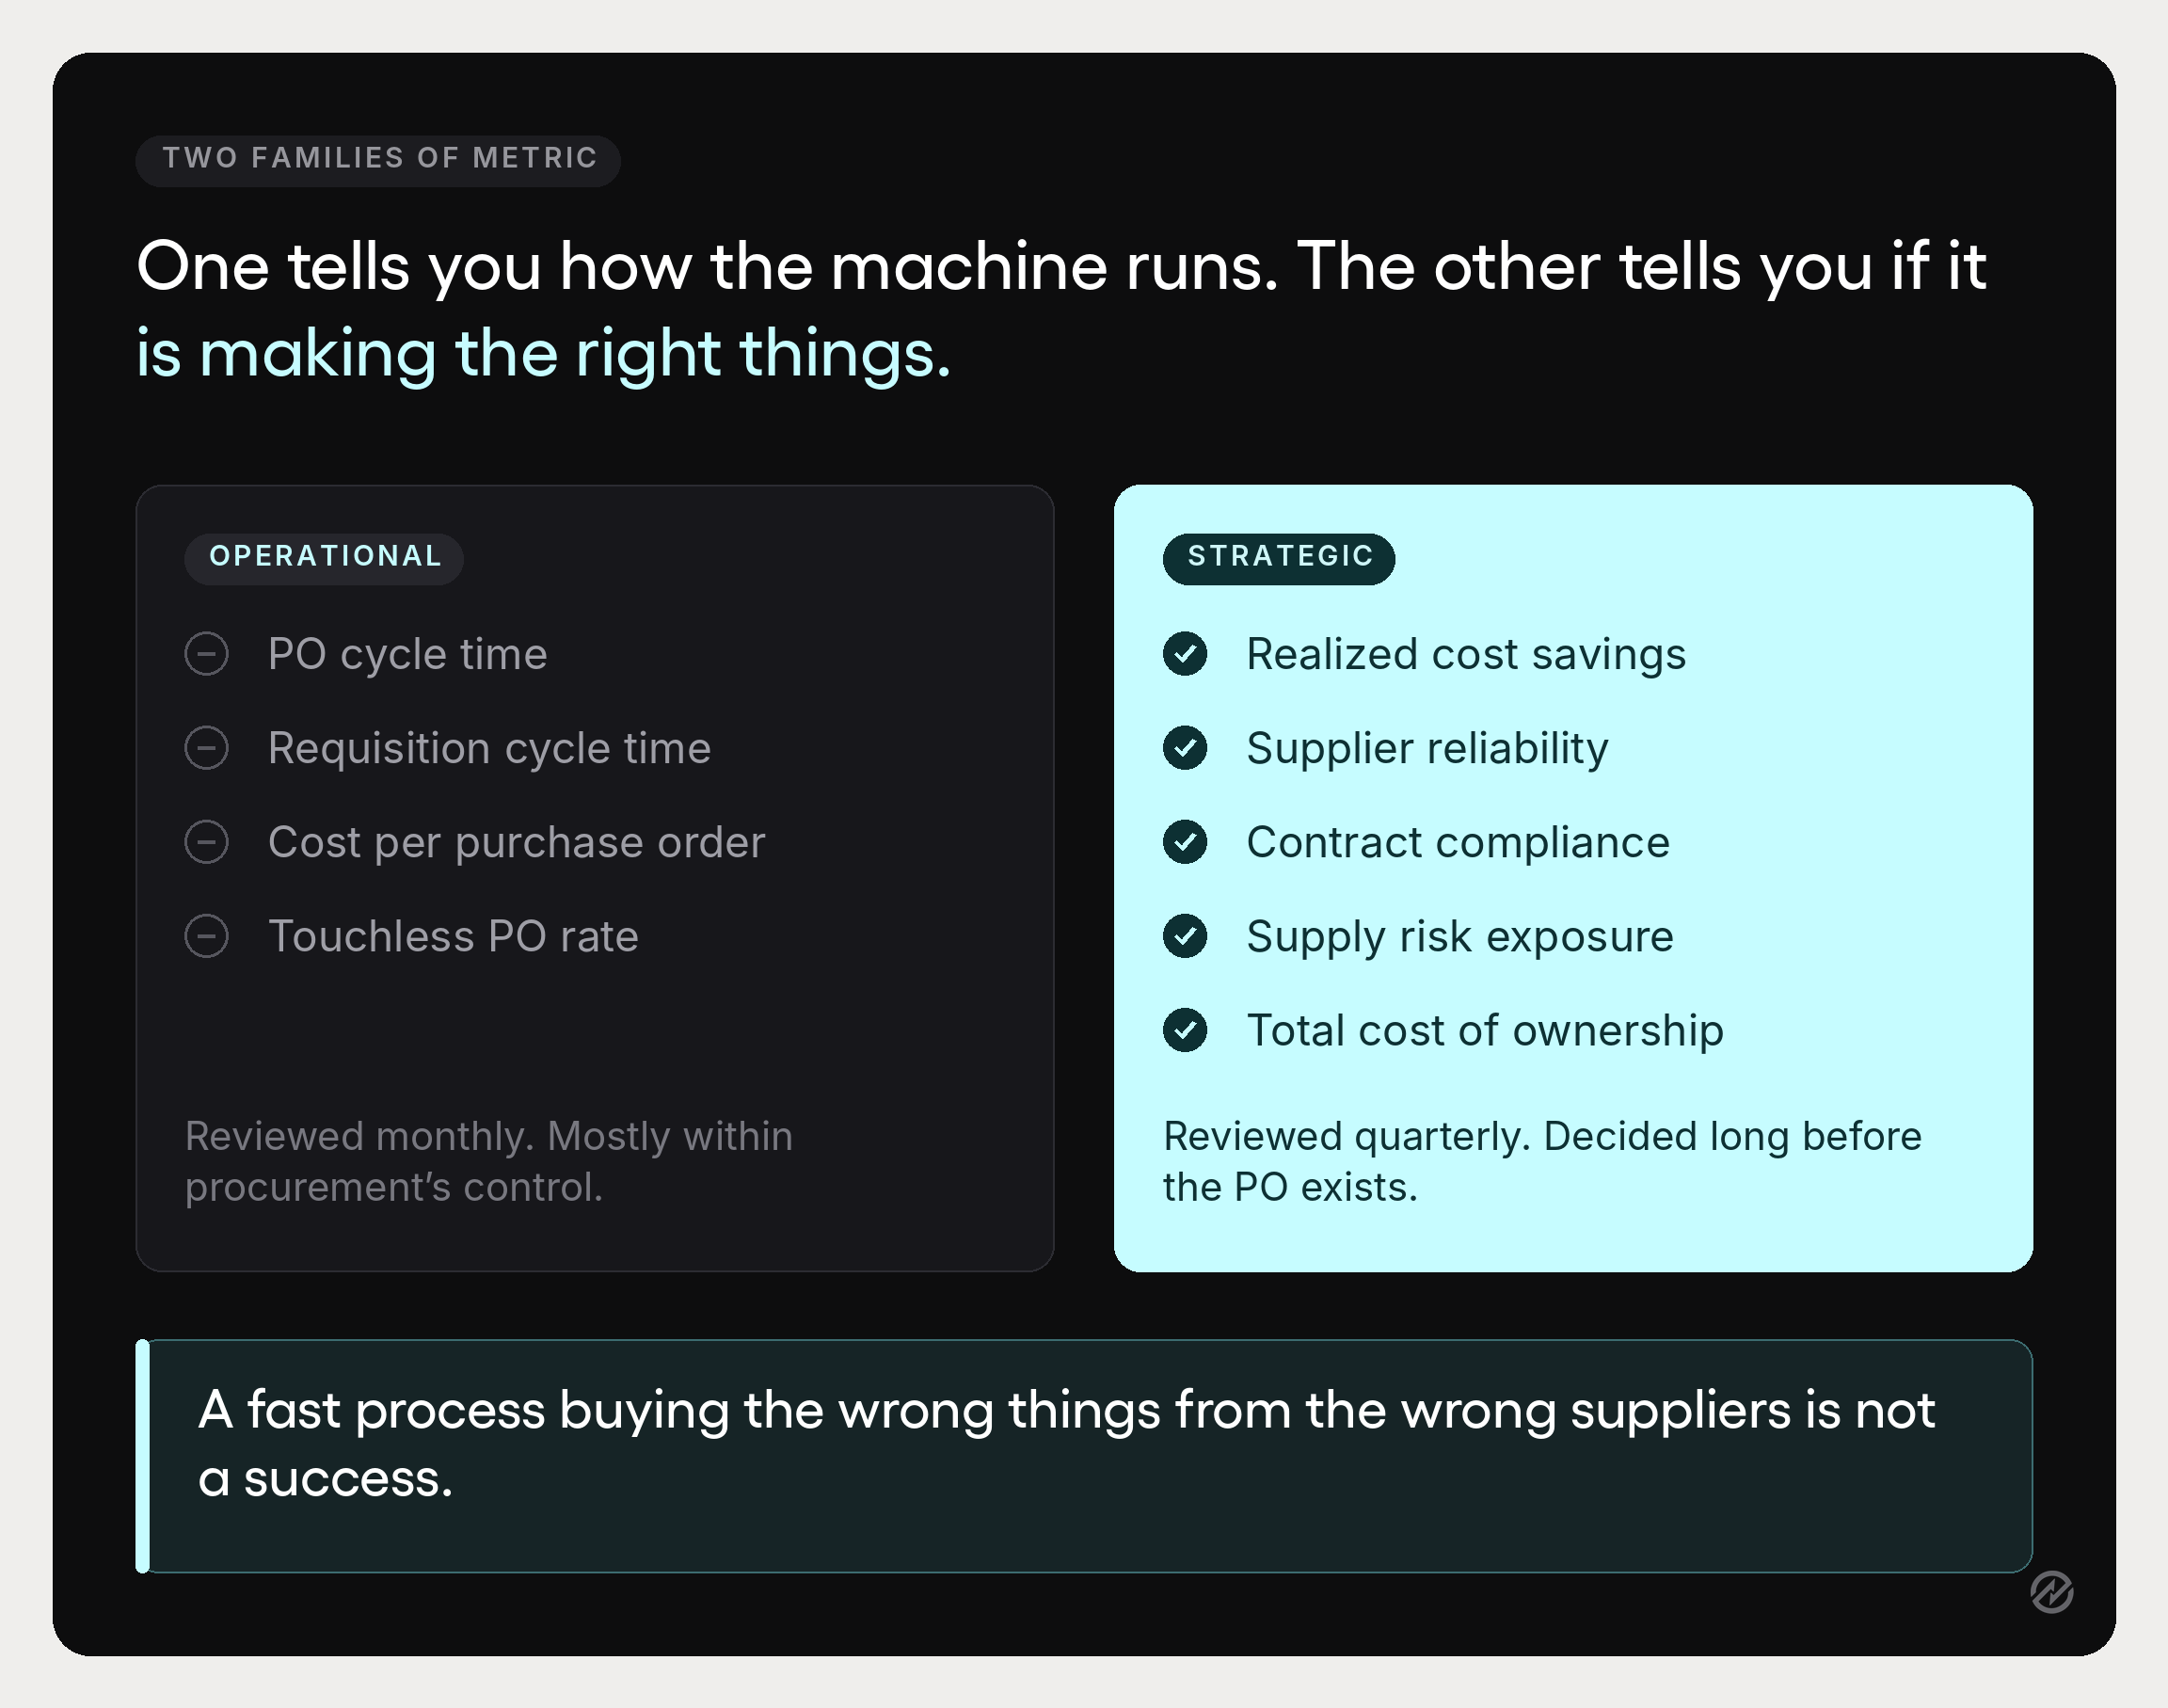
- Measure efficiency and effectiveness separately. Cycle time and cost per purchase order tell you how well the machine runs. Supplier reliability, compliance, and realized savings tell you whether it is producing the right outcomes. A fast process buying the wrong things from the wrong suppliers is not a success.
Why most procurement dashboards get ignored
Before the metrics themselves, it is worth naming why so many scorecards fail to change anything. Four patterns come up repeatedly.
- The numbers have no owner. A metric on a dashboard that nobody is accountable for is decoration. Every measure needs a named person who is expected to explain it when it moves.
- They measure activity, not outcome. Purchase orders processed, requisitions handled, suppliers onboarded. These describe procurement activity and how busy the department was. None of them indicate whether the organization is buying better.
- Savings are calculated inconsistently. Two categories report savings using different baselines, and the total becomes meaningless. This is why finance discounts procurement numbers, and the discount is usually deserved.
- There are too many metrics. A scorecard with thirty measures is a scorecard with no priorities. Procurement leaders who report ten numbers monthly get more attention than those who report forty quarterly, because ten can be discussed and forty can only be circulated.
The common thread is that procurement data is collected without a decision attached. Tracking metrics is not the same as managing with them.
Efficiency, effectiveness, and why the distinction matters
Procurement metrics fall into two families, and conflating them is how teams end up optimizing the wrong thing.
Operational metrics measure how well the process runs. Purchase order cycle time, cost per purchase order, requisition-to-order time, touchless PO rate. These operational KPIs describe process efficiency and operational efficiency inside the procurement function. They are largely within the procurement function’s control, and they improve with better workflows and automation.
Strategic metrics measure whether the buying is any good. Realized cost savings, supplier reliability, contract compliance rate, supply risk exposure, total cost of ownership. These strategic KPIs describe procurement performance in business terms, and they depend on decisions made well before a purchase order exists.
Most procurement teams over-index on the operational side, because those numbers are easier to collect and easier to improve. A team can cut PO cycle time by 40% and have no effect whatsoever on what the company pays or how reliably it gets delivered.
The reverse failure is rarer and equally damaging. Strategic metrics with no operational measures underneath produce a function that negotiates well and executes slowly, where the savings exist on paper and the business routes around procurement to get anything done.
A working scorecard carries both, usually at a ratio of roughly one operational measure for every strategic one, with the operational numbers reviewed more frequently.
Cost metrics: what you saved, and whether finance will agree
Cost savings KPIs are where procurement credibility is won or lost. The measures below are ordered by how easily they survive scrutiny.
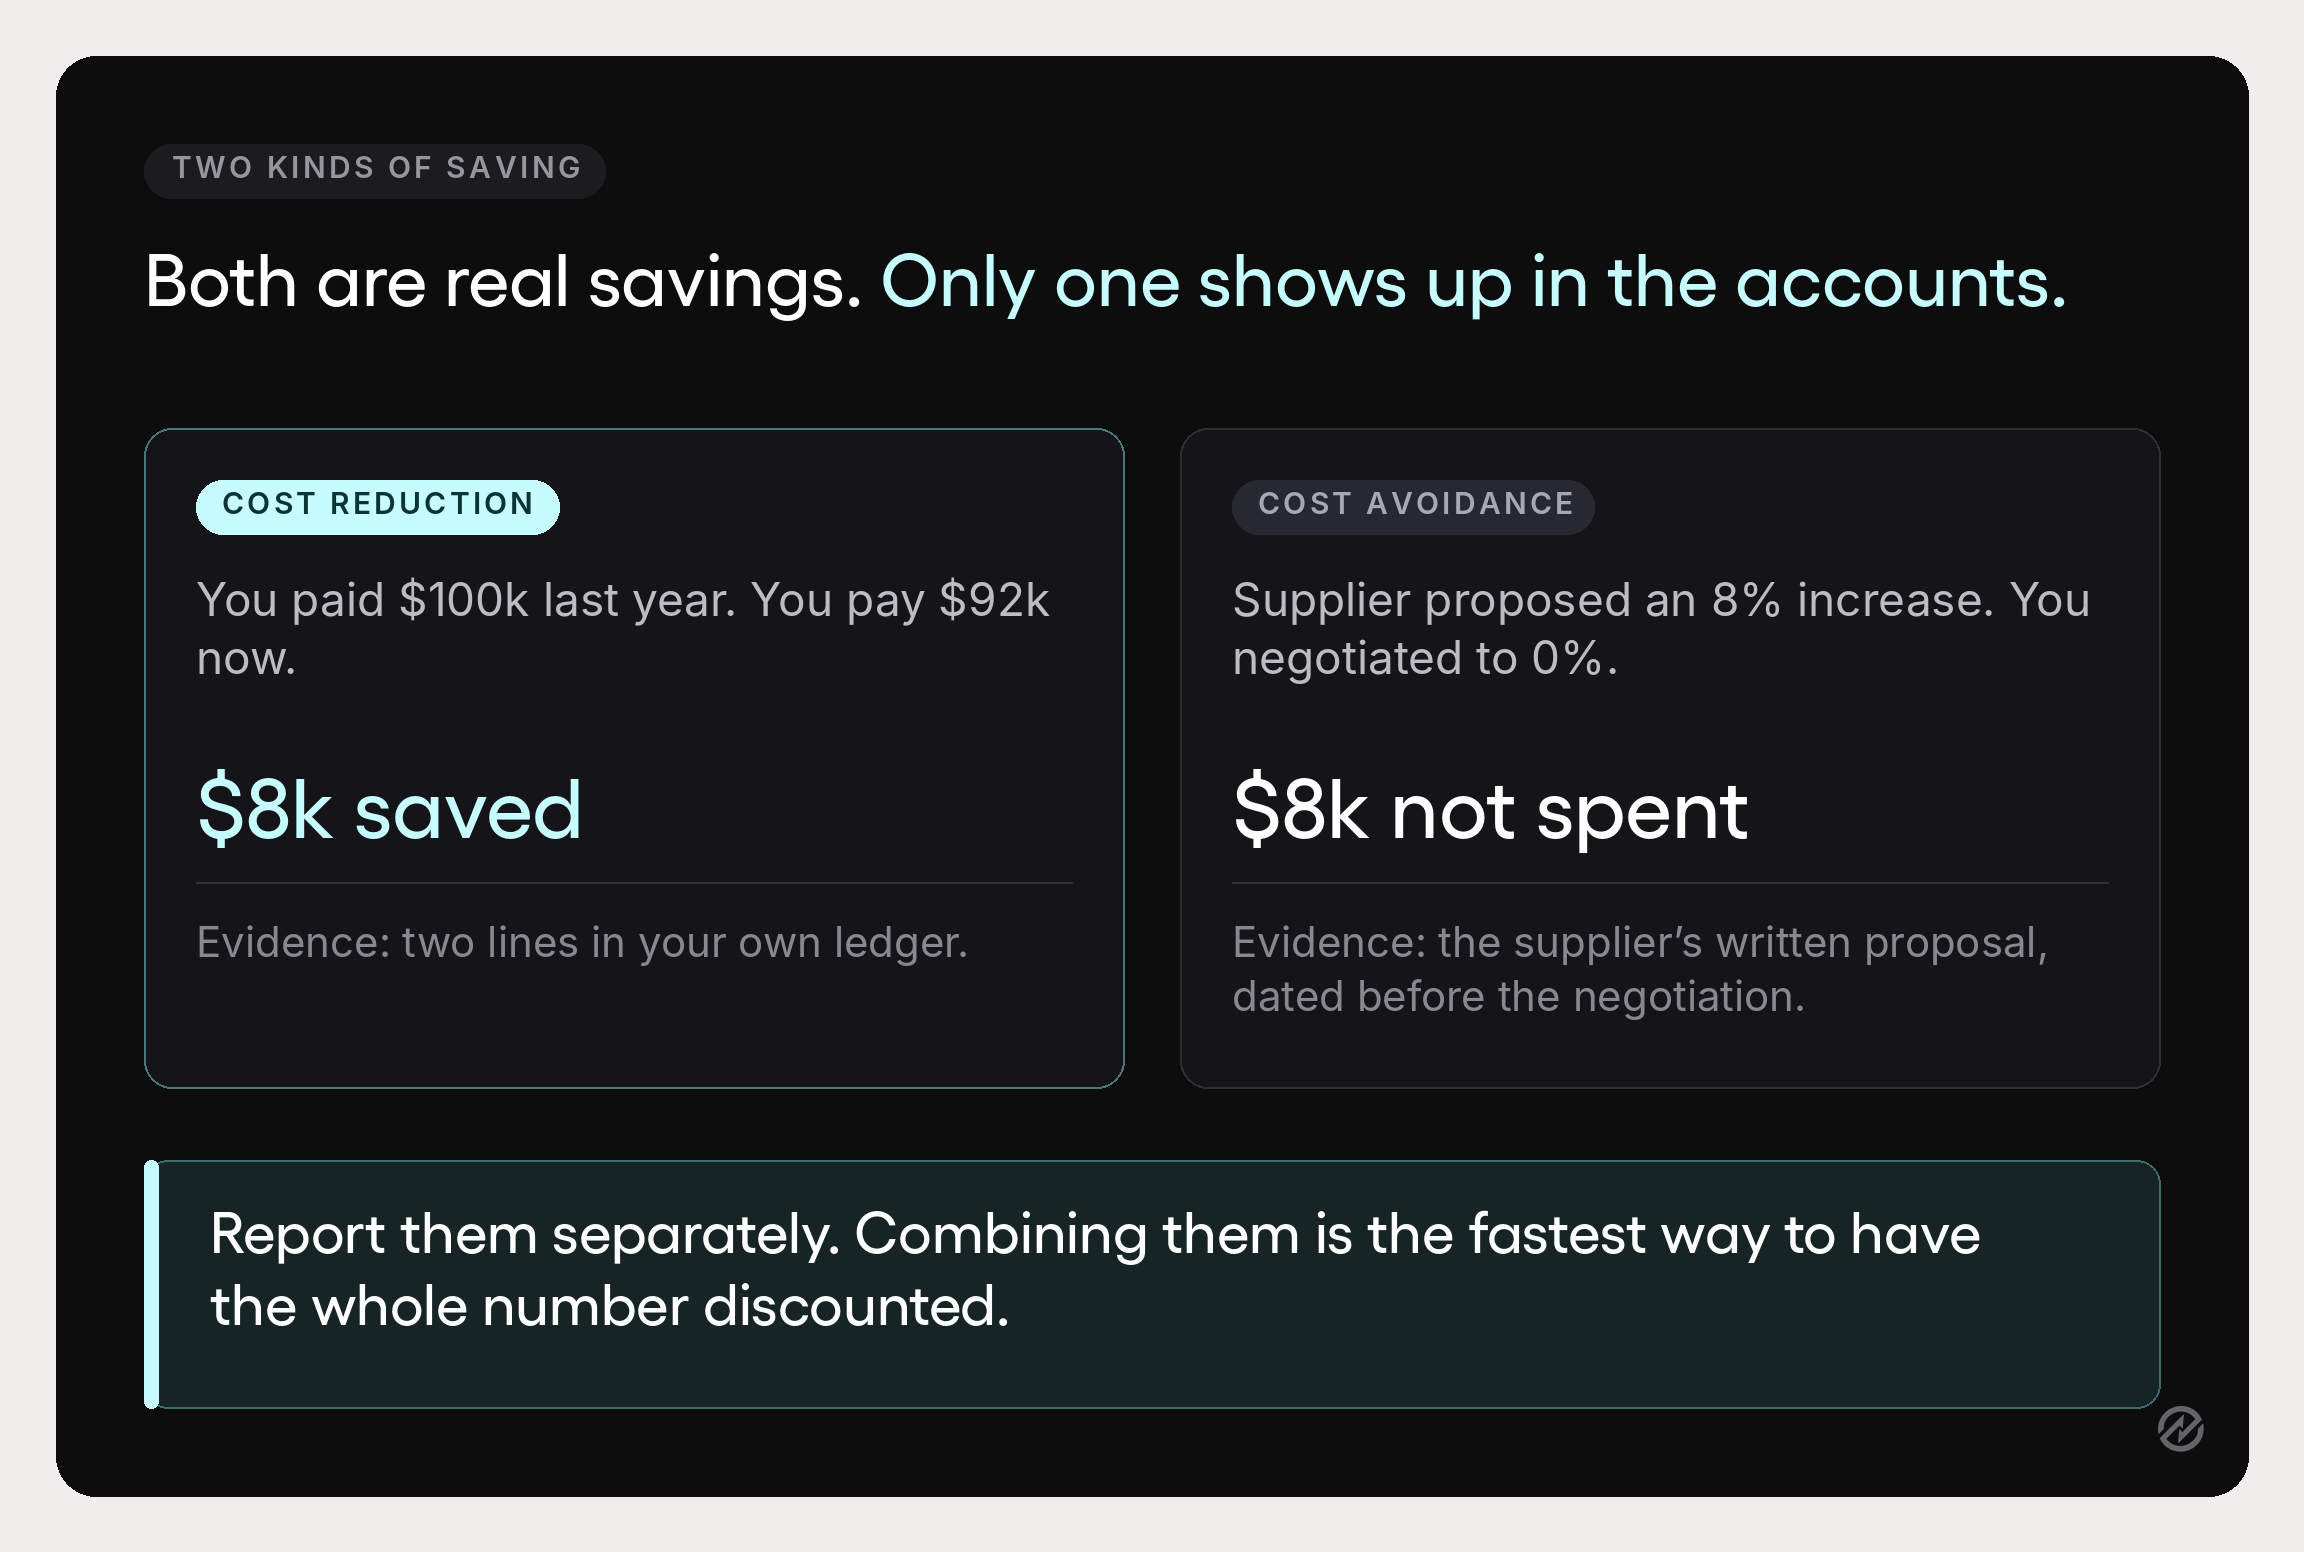
Cost reduction
What it measures. An actual decrease in what the organization pays for the same thing.
Formula. [(Previous cost − Current cost) ÷ Previous cost] × 100
Why it holds up. It compares two real numbers from your own accounts. When finance asks where the money went, you can point at a line that got smaller.
The trap. Volume changes distort cost savings measures. Paying less because you bought less is not a saving. Normalize for quantity or the number will be challenged and you will lose the argument.
Cost avoidance
What it measures. Costs that would have been incurred but were not, typically a supplier price increase you negotiated down or away.
Why it is harder. It compares reality against a hypothetical. Avoiding a proposed 8% increase is genuine value, and it never appears as a reduction in spend, which makes it invisible on the income statement and easy to dispute.
How to make it defensible. Document the proposed increase in writing at the time, not afterward. Cost avoidance supported by a supplier’s own letter is evidence. Cost avoidance asserted at year-end is a claim.
Report the two separately. Combining them into one savings figure is the single fastest way to have the whole number discounted.
Procurement ROI
What it measures. Financial return relative to what the procurement function costs to run.
Formula. (Annual cost savings ÷ Annual procurement costs) × 100
What it is actually for. Justifying headcount and technology investment, and demonstrating value creation from the procurement operations budget. It is the number that answers whether the procurement department pays for itself, which is a question that gets asked during budget season, whether or not anyone has prepared for it.
Purchase price variance
What it measures. The difference between what you agreed to pay and what you were actually invoiced.
Why it belongs on the list. Purchase price variance is where negotiated savings quietly leak away. A contract at an agreed rate means nothing if invoices arrive at a different one and nobody compares them. Rising PPV usually indicates a control problem rather than a supplier problem.
Total cost of ownership
What it measures. The full cost of a purchase across its life: price, delivery, quality failures, administrative effort, and what it will cost to leave the supplier later, including data migration, retraining, and early-termination fees.
Why it changes decisions. Cost control starts here, because unit price is the most visible cost and rarely the largest. Two suppliers with a 4% price difference can have a 20% difference in total cost once you count returns, expediting, and rework. TCO is harder to calculate, but it reflects what the relationship actually costs.
Speed metrics: where the days actually go
Process efficiency measures tell you whether procurement is a bottleneck. Track them at the stage level, because totals identify that a problem exists without locating it.
Purchase order cycle time
What it measures. Time from purchase order creation to receipt of goods.
Formula. Order completion date − order creation date
Benchmark context. APQC's Open Standards Benchmarking puts the cross-industry median at 2.0 days from purchase requisition to purchase order for goods, across 1,181 organizations. Treat it as orientation instead of a target, since category mix affects this number more than company size does.
Why it matters beyond speed. Slow PO cycle time pushes internal stakeholders toward buying outside the process. Every week added to the cycle increases the odds that someone orders directly and files paperwork later.
Requisition cycle time
What it measures. Time from request submission to approved purchase order.
Why separate it from PO cycle time. These two measure different failures. Requisition cycle time is about internal approvals, and the purchase requisition process is where it is fixed. PO cycle time is about supplier fulfillment. A team that reports only the combined figure cannot tell whether to fix its approval workflows or its suppliers.
Cost per purchase order
What it measures. The administrative cost of processing a single PO.
Formula. Total procurement operating costs ÷ number of purchase orders
What it reveals. This is the clearest measure of whether automation is working. It also exposes tail spend: if a large share of purchase orders are low-value, the administrative cost of processing them may exceed the value of the purchases themselves. Procurement automation is the usual response.
Touchless purchase order rate
What it measures. The percentage of purchase orders that are completed without manual intervention.
Why it is the automation metric. It is one of the few key metrics that maps directly to how automated your procurement workflows really are, where every other automation measure is a proxy. This one directly counts how many transactions required a human to do something mechanical. Improving it reduces operational costs without touching headcount.
Supplier metrics: reliability you can prove
Supplier performance metrics turn renewal conversations from impressions into evidence. The set below covers the four dimensions that matter across most categories.
On-time in-full delivery
What it measures. The percentage of orders delivered complete and on schedule.
Why OTIF rather than on-time delivery alone. A delivery that arrives on time with 60% of the quantity is not a success, and measuring only timeliness lets that pass. Combining both into one figure is harder for a supplier to argue with.
Supplier defect rate
What it measures. The percentage of received items that fail quality standards.
Formula. (Defective items ÷ total items received) × 100
Where it connects. Tracked in supplier management software, supplier quality is a cost metric wearing different clothes. Defects generate returns, rework, expediting, and (in production environments) downtime. Tracking defect rate alongside unit price is what makes total cost visible.
Supplier lead time
What it measures. Average time from order placement to delivery.
What it is really for. Planning. A supplier with a long but consistent lead time is easier to work with than one with a short but erratic one. Track the variance alongside the average, because supplier reliability is about predictability as much as speed.
Supplier availability rate
What it measures. How often a supplier can meet demand when asked.
Why it matters for supply continuity. Supplier availability is the early indicator of a capacity problem. It typically deteriorates months before an outright failure to deliver, which gives you time to act if anyone is watching.
Supplier responsiveness
What it measures. Time to respond to queries, quotes, and issues.
Why it belongs on a scorecard. It is the softest measure here and the one that most reliably predicts how a relationship will behave under stress, which matters in supplier negotiations as much as in day-to-day delivery. Suppliers who are slow to answer when things are fine do not become fast when things go wrong.
Building a supplier scorecard
Individually, these measures describe incidents. Combined into a supplier scorecard, they describe a relationship, which is what makes them useful in supplier relationship management.
A workable scorecard weights the measures by what the category actually needs, which is also how supplier evaluation should work in practice. A production input weights quality and continuity heavily. An office supplies contract weights price and responsiveness. Used consistently, scorecards are what build strong supplier relationships on evidence rather than familiarity. Composite scoring into a single supplier performance index is optional and often counterproductive, since it hides the specific failure you would want to discuss.
The requirement that trips most teams up is data. Supplier scorecards need accurate, timely information pulled automatically from receiving and invoice records. A scorecard maintained by hand gets updated for the first quarter, then stops.
Control metrics: how much spend the process actually governs
These are the measures that tell you whether procurement policy is real or aspirational, and they are consistently the most under-reported group.
Spend under management
What it measures. The share of total spend that runs through the procurement process, against approved suppliers and negotiated contracts.
Formula. (Spend covered by procurement ÷ total spend) × 100
Why it is the most diagnostic number available. Every other procurement achievement is bounded by this one. A team saving 12% on the spend it controls is doing less for the business than the figure suggests if it only controls 40% of company spending. Raising spend under management is usually worth more than improving savings on the portion already governed.
Deloitte's 2025 Global Chief Procurement Officer Survey, covering more than 250 CPOs across 40 countries and 10 industries, found the organizations it classifies as Digital Masters reporting roughly 80% spend influence against 65% for Followers. The same group managed around $20 million in spend per procurement employee, six times the figure reported by Followers, which says something about what process maturity does for procurement efficiency.
Contract compliance rate
What it measures. The percentage of purchases made against negotiated contract terms.
Why it is the companion to savings. A negotiated rate delivers nothing if buyers do not use it, which is where strategic sourcing work leaks away. Contract compliance makes the gap between an agreement and a result visible, and a low rate explains a savings number that finance cannot find.
Maverick spend rate
What it measures. Purchases made outside approved procurement channels, as a percentage of total spend.
Why it deserves its own line. Maverick spend is the inverse of contract compliance and behaves differently as a management signal. A rising rate usually means the approved process is too slow or too hard, not that people are ignoring rules for sport. Treat it as feedback on the workflow instead of a discipline problem, and it becomes useful.
Emergency purchase ratio
What it measures. Emergency or expedited purchases as a percentage of total purchases.
What it actually reveals. Planning quality. A high emergency rate points at demand forecasting, inventory management, or lead-time assumptions rather than at procurement execution. It is also expensive: emergency buying forfeits negotiating position on every transaction.
Purchase order accuracy
What it measures. The percentage of purchase orders issued without errors in quantity, price, or specification.
Where it pays off. Downstream. Inaccurate POs generate invoice mismatches during three-way matching, receiving disputes, and rework in accounts payable. A small number that drives high administrative cost.
Risk metrics: the ones nobody tracks until it is too late
Risk measures rarely appear on procurement dashboards, which is a mistake, because they are the only ones that give you warning.
Supplier concentration risk
What it measures. How much spend in a category depends on a single supplier.
Why it belongs on the monthly report. Concentration is invisible until it matters, and then it is the only thing that matters. Supply chain disruptions rarely announce themselves, and single-source disruptions become company problems within days. Knowing which categories are single-sourced, and what replacement would take, is the difference between a supply disruption you manage and one you absorb.
Supplier risk rating
What it measures. A composite view of financial stability, delivery performance, compliance status, and geographic exposure for key suppliers. It is the backbone of procurement risk management.
How to keep it honest. You can check financial stability through credit data. Delivery and compliance come from your own records. Geographic and regulatory exposure requires judgment. Rating suppliers on a simple scale and reviewing quarterly beats an elaborate model reviewed never.
Supply continuity exposure
What it measures. Estimated time to replace a supplier in a given category.
Why the estimate is the point. Very few organizations have ever calculated this, and the exercise itself changes behavior. Discovering that a critical input would take eleven months to re-source is the kind of finding that gets budget attention for supply chain resilience.
Direct and indirect procurement do not share a scorecard for a good reason
This distinction gets skipped in most metrics guides, and it is the one that most affects whether your dashboard is useful.
Direct procurement covers goods and services that go into what the organization sells: raw materials, components, production inputs.
Indirect procurement covers everything needed to operate: software, facilities, professional services, office supplies.
They fail differently, so you should measure them differently.
What direct procurement metrics should emphasize
Direct spend sits on the critical path. A supply failure stops production, so the measures that matter most are continuity and quality.
- Supplier defect rate and OTIF delivery, weighted heavily. Quality failures in direct materials propagate into finished goods.
- Supplier lead time and variance, because production planning depends on predictability.
- Purchase price variance, since unit economics on direct inputs flow straight into margin and small percentage moves are material.
- Supplier concentration risk, because single-sourcing a production input is an operational exposure, not a commercial one.
- Total cost of ownership, including quality failure costs and expediting.
Direct procurement metrics tend to be reported more frequently, sometimes weekly, because the consequences of a problem arrive fast. This is also where strategic procurement earns its name, since decisions focus on supply security rather than price.
What indirect procurement metrics should emphasize
Indirect spend rarely stops anything. It leaks. The risk is not disruption but uncontrolled, fragmented spending across business units that nobody consolidates.
- Spend under management and contract compliance rate, because the core problem is spend escaping the process.
- Maverick spend rate, which is almost entirely an indirect phenomenon.
- Cost per purchase order, since indirect spend generates high transaction volume at low individual value.
- Supplier consolidation opportunities, visible through spend fragmentation across categories.
- Requisition cycle time, because slow approvals on low-value purchases are what drive people around the process in the first place.
The practical implication: if you report one blended set of numbers across both, the direct metrics will look fine because that spend is already controlled, and the indirect problems will stay hidden inside the average. Split the reporting.
The metric procurement teams often forget to measure
Almost every scorecard in this guide measures suppliers, spend, or process. Very few measure how the rest of the organization experiences procurement, and that omission has consequences.
Internal stakeholder satisfaction measures whether the people who submit requests find the process workable. You can collect it with two questions in a quarterly pulse: how easy it was to get what you needed, and how long it took compared to what you expected.
It matters because it predicts maverick spend better than any control metric does. People do not route around procurement out of malice. They route around it because the approved path was slow, unclear, or required information they did not have. A department with low satisfaction scores this quarter is a department with rising off-contract purchases next quarter, and the satisfaction number gives you a warning the compliance number does not.
It also protects against a specific failure mode: a procurement function that optimizes its own metrics at the expense of everyone else’s. Tightening thresholds and adding approval stages will improve compliance and control figures but slow the business. Without a stakeholder measure in the set, that tradeoff is invisible on the dashboard and extremely visible everywhere else.
Treat it as a strategic metric, reviewed quarterly, owned by whoever owns the process design.
Where technology investment shows up in the numbers
The link between procurement systems and procurement performance is easy to assert and harder to evidence, so it is worth being careful about what the available data actually supports.
The same Deloitte survey found that Digital Masters reported an average 3.2x return on generative AI investments, compared with 1.6x for Followers, and allocated 24% of their procurement budget to technology against 18%. Both groups expect that share to rise next year.
Read that carefully. It is a correlation across a self-selected group of high performers, not a demonstration that buying software produces returns. Organizations that invest more in procurement technology also tend to have clearer processes, better data discipline, and executive sponsorship, any of which could drive the performance gap on its own.
What the data does support is narrower and still useful: the measurement capability and the performance tend to travel together. Teams that can produce reliable numbers usually have connected systems, and teams with connected systems usually see their numbers improve because they can see what is happening in time to act on it.
The practical implication for a scorecard is to treat technology as an enabler of measurement, never as a metric in itself. “Percentage of transactions in the system” is worth tracking. “Number of modules deployed” is not.
The process that turns a metric into a decision
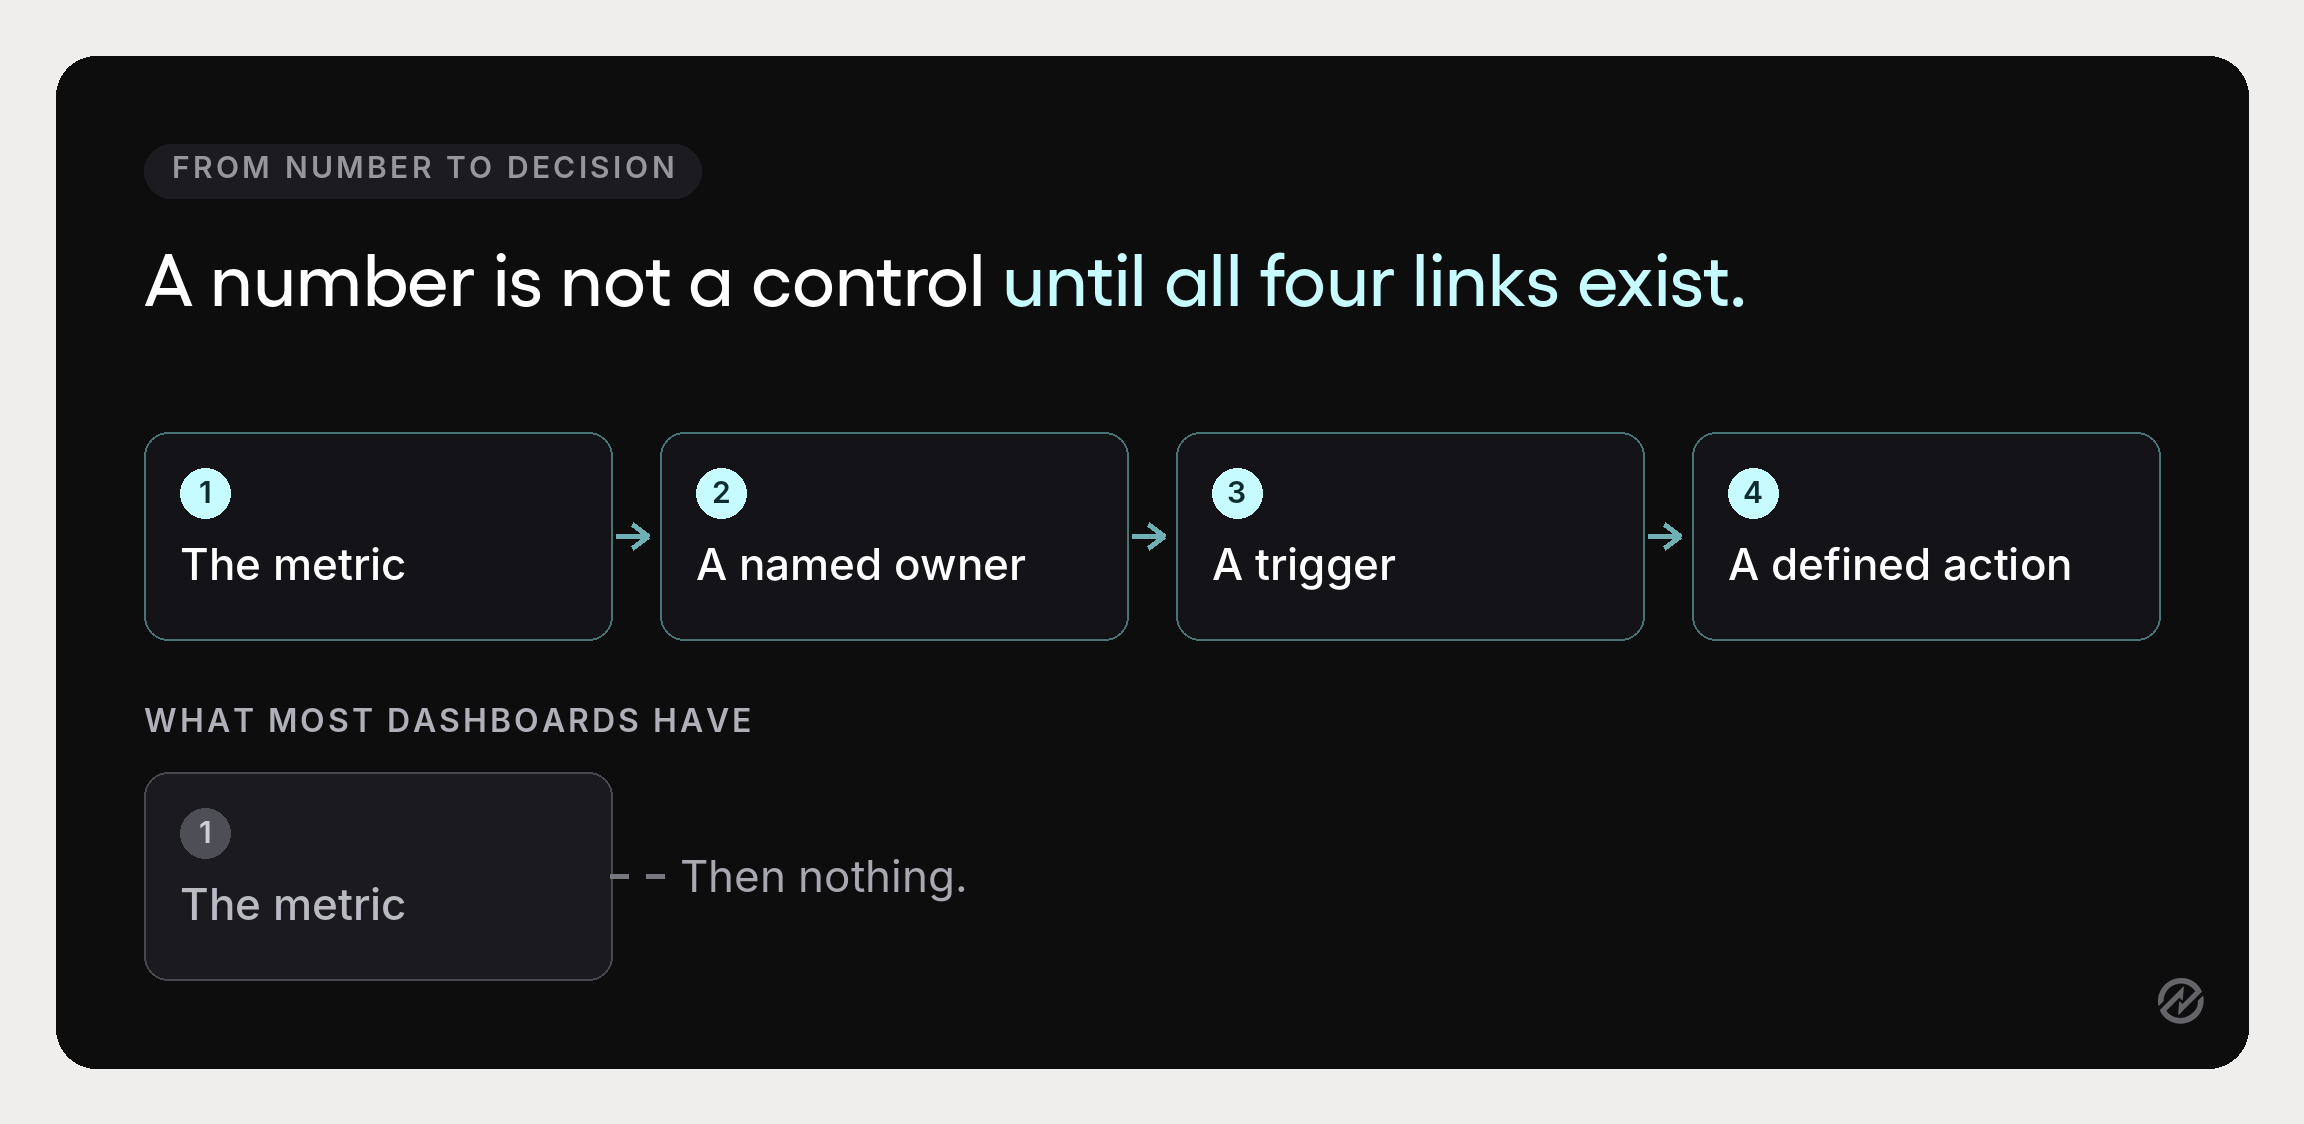
Strong procurement metrics create a line of accountability that runs from a number to an owner to an action. Weak ones stop at the number.
For each measure on your scorecard, four things should be defined.
The owner. A named person, not a department. Someone who is expected to explain the number when it moves and who has the authority to do something about it.
The threshold. The point at which the number requires a conversation. Without one, a metric drifts for three quarters before anyone decides it is a problem.
The action. What happens when the threshold is breached. If nobody can name the action, the metric is not a control; it is a statistic.
The cadence. How often it is reviewed. Operational KPIs monthly, strategic KPIs quarterly is a reasonable default. Reporting everything at the same frequency means the fast-moving numbers get stale and the slow ones get over-analyzed.
This is also how procurement metrics connect to business objectives rather than sitting in a functional silo. Cost reduction ties to margin and cash flow. Cycle time ties to internal customer satisfaction and to how quickly the business can act. Supplier reliability ties to revenue continuity.
Spend under management ties to financial control, and sustained performance across all four is what turns procurement into a competitive advantage rather than an overhead line. Making those links explicit in the reporting is what gets procurement taken seriously as a contributor to business performance rather than a cost center that occasionally saves money.
What your systems have to do before a number is trustworthy
Every metric above assumes the underlying data exists and is reliable. For a lot of procurement teams that assumption is the actual constraint, and no amount of dashboard design fixes it.
Four requirements determine whether procurement KPIs are trustworthy.
Transactions have to run through one process. If half of purchasing happens outside the system, every metric describes the half you can see. This is why spend under management is both a metric and a precondition for the others.
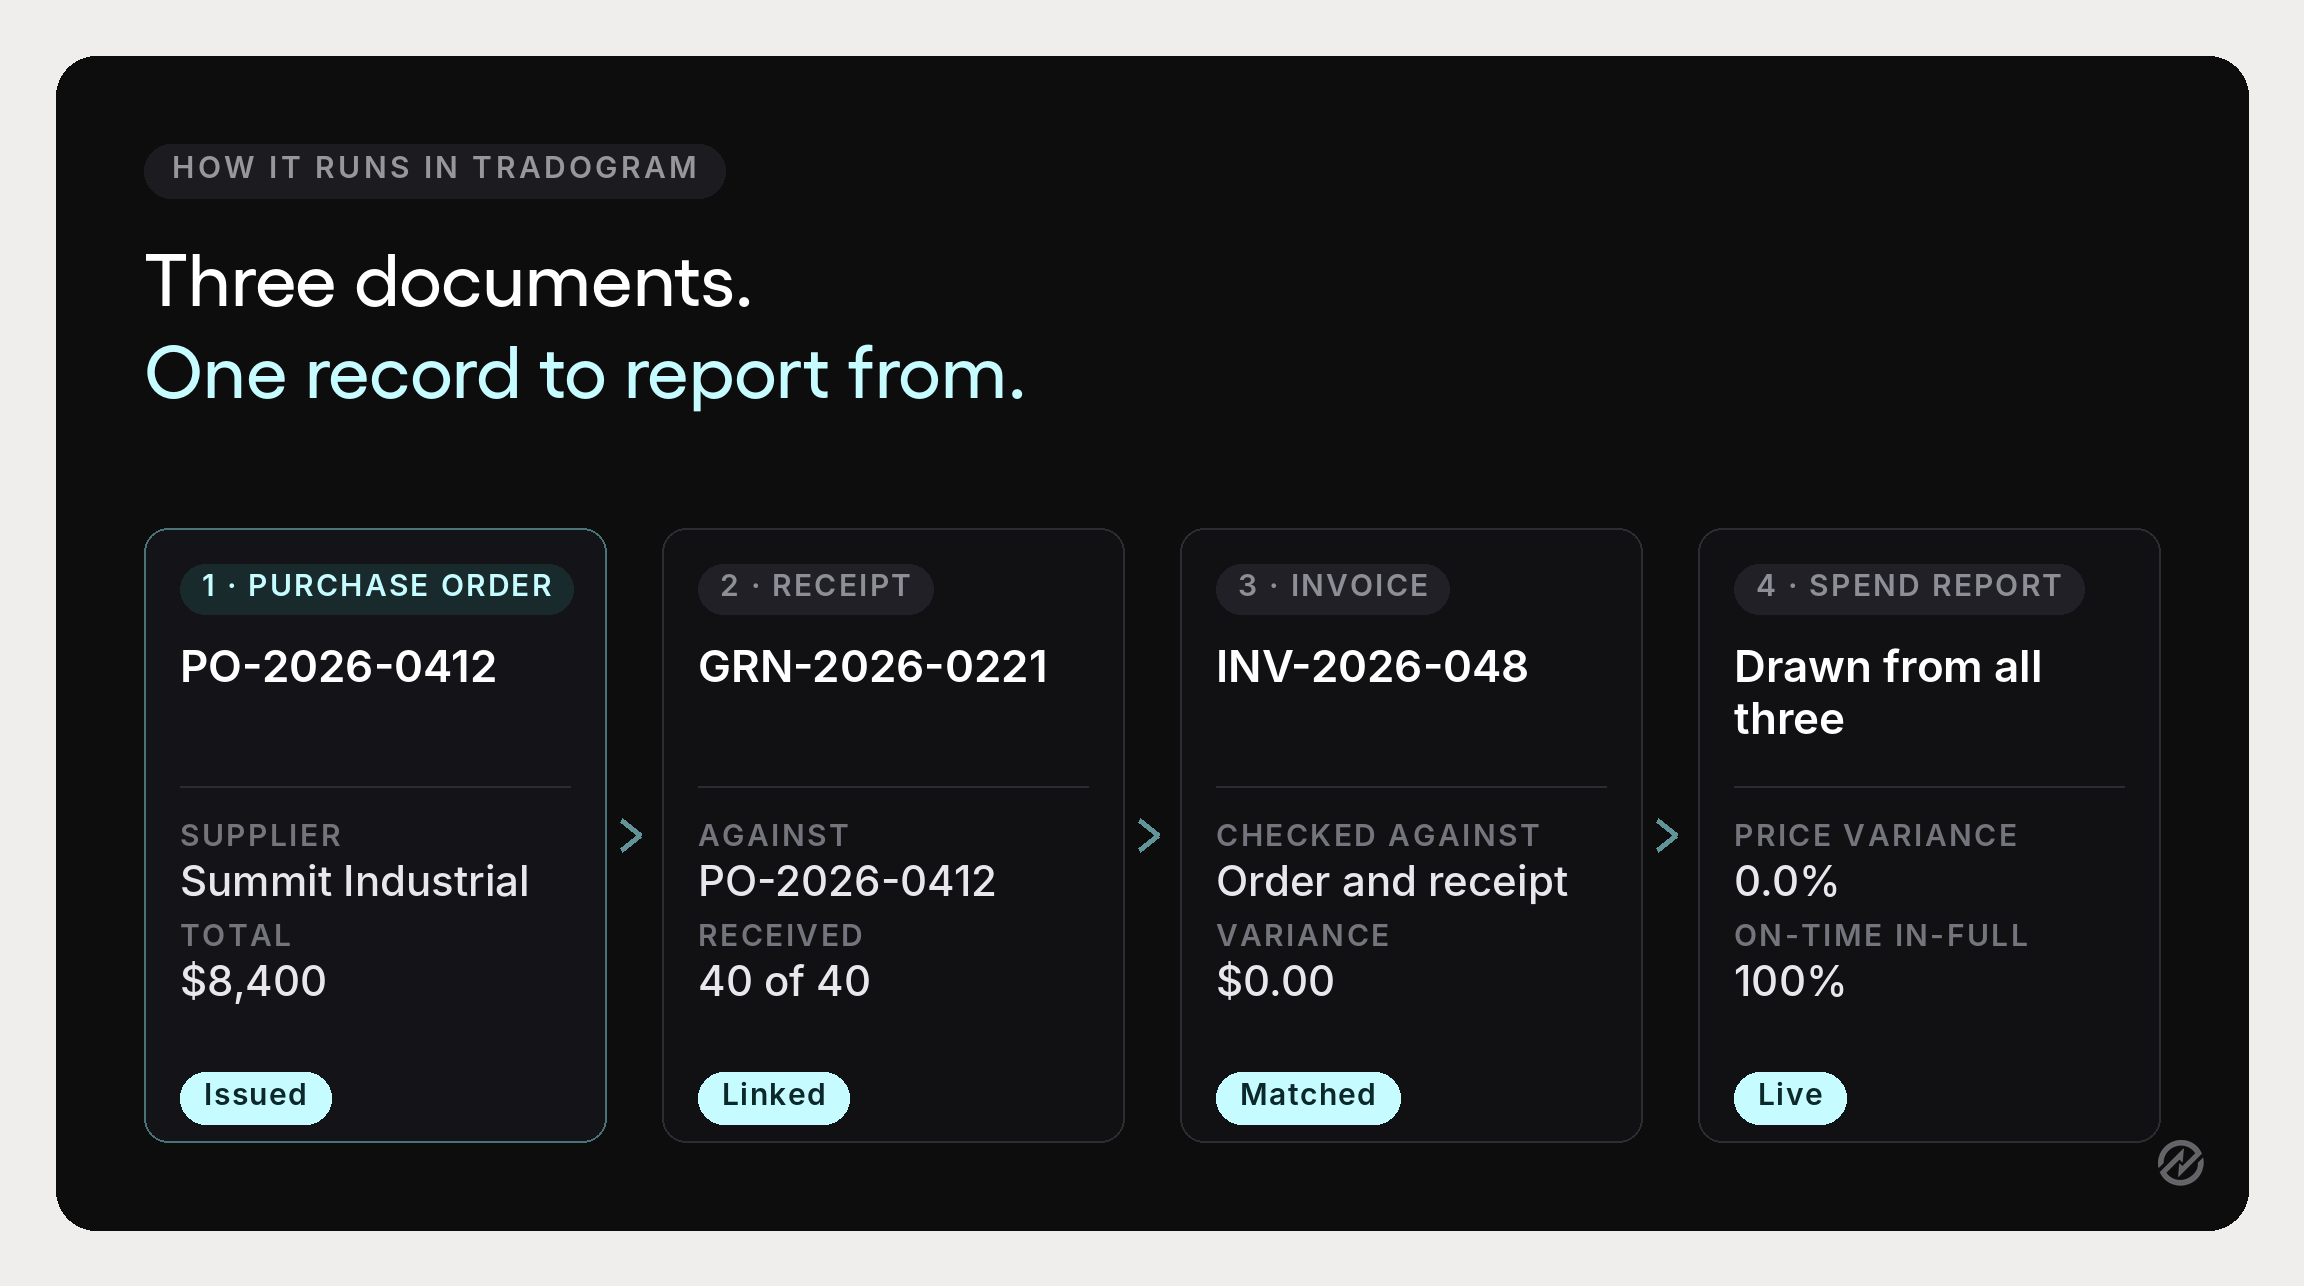
Records have to link. A purchase order, its receipt, and its invoice need to be connected. Purchase price variance, OTIF, and defect rate all depend on comparing documents that most organizations store separately.
Categories have to be coded consistently. Spend analysis falls apart when the same category is recorded three ways across business units. This is unglamorous data hygiene, and it determines whether category-level reporting is possible at all.
Collection has to be automatic. Metrics assembled by hand get produced reliably for one quarter. Reporting that pulls from the system as transactions happen is what keeps a scorecard alive during a busy month.
Procurement reporting built on connected records turns these from a data project into a view. Where purchase requests, approvals, purchase orders, receiving, and invoices share one record, most of the metrics in this guide are already calculable without anyone exporting anything.
That connection is also what makes the numbers actionable rather than historical. Knowing that PO cycle time rose last quarter is information. Seeing which approval stage caused it produces actionable insights, and the difference between the two is whether the data lives in one place.
Benchmarks are orientation, not targets
Procurement professionals are frequently asked how their numbers compare to the industry, and the honest answer is that the comparison is less useful than it sounds.
Category mix drives most procurement metrics more than company size or sector does. An organization buying mostly contracted services will have a very different PO cycle time from one buying spot-market commodities, and neither is performing better.
Two comparisons are more useful than an industry benchmark.
Your own trend. Whether the number is improving against where you were, on a consistent measurement basis. This is the comparison that supports a decision.
Internal variance. How the same metric differs across business units or categories. A department with a maverick spend rate three times the company average is a more actionable finding than the company average itself, and it points directly at what to investigate.
Use external benchmarks to sanity-check for order-of-magnitude problems. Use internal comparisons to decide what to do on Monday.
Choosing the ten numbers you will actually use
A scorecard works when it is short enough to discuss in a meeting. Ten measures is a reasonable ceiling for most procurement teams, and reaching it requires deleting things.
Start from what the organization is worried about. A company under margin pressure needs cost reduction, PPV, and contract compliance near the top.
A company that had a supply failure last year needs concentration risk, OTIF, and supplier availability.
A company scaling headcount fast needs cycle time, cost per PO, and spend under management. The right scorecard reflects the current problem, not a generic template.
Then apply three filters to each candidate.
- Would we act on this? If the number moved 20% in either direction, would anyone do anything? If not, remove it.
- Can we calculate it consistently? A metric that requires manual assembly or a judgment call each period will drift and then be abandoned. Prefer a simpler measure you can produce reliably.
- Does it have an owner? Unowned metrics do not get explained, and metrics that do not get explained stop being read.
The most important procurement KPIs are the ones that describe your current problem, which is why no universal list exists.
That said, a realistic starting set for a mid-market team: cost reduction against a documented baseline, purchase price variance, spend under management, contract compliance rate, requisition cycle time, PO cycle time, OTIF delivery, supplier defect rate, maverick spend rate, and supplier concentration risk for the top categories. Four cost and control measures, three speed measures, three supplier measures.
Add the strategic sourcing and inventory measures when the basics are producing reliably.
Review the set annually. Metrics that were urgent two years ago frequently describe a problem you already solved, and keeping them crowds out the ones that describe the current one. Procurement success is easier to demonstrate with a short, current scorecard than a long, historical one.
If you want a shorter starting point, our guide to the nine procurement KPIs worth tracking first covers the core set with benchmark context for each.
Tradogram connects purchase requests, approvals, purchase orders, receiving, invoice matching, and supplier records in one system, which is why most of these measures are reports rather than projects. If you want to see which of them you could produce from your current data, book a demo and we will work through your category mix.